GoiLoan 736GS2052_GS full analysis,charts,indicators,moving averages,SMA,DMA,EMA,ADX,MACD,RSIGoi Loan 736GS2052_GS WideScreen charts, DMA,SMA,EMA technical analysis, forecast prediction, by indicators ADX,MACD,RSI,CCI NSE stock exchange
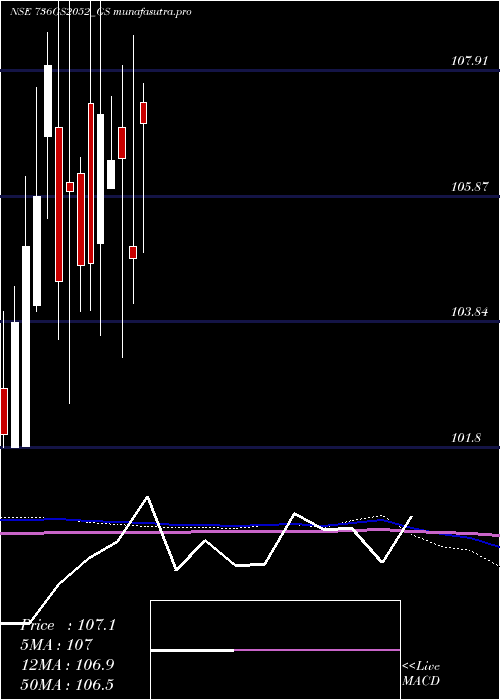
Daily price and charts and targets GoiLoan Strong Daily Stock price targets for GoiLoan 736GS2052_GS are 104.63 and 105.88 | Daily Target 1 | 103.58 | | Daily Target 2 | 104.42 | | Daily Target 3 | 104.83333333333 | | Daily Target 4 | 105.67 | | Daily Target 5 | 106.08 |
Daily price and volume Goi Loan
| Date |
Closing |
Open |
Range |
Volume |
Fri 24 October 2025 |
105.25 (1.2%) |
104.00 |
104.00 - 105.25 |
0.0006 times |
Mon 20 October 2025 |
104.00 (0%) |
104.00 |
102.51 - 104.00 |
0.2262 times |
Fri 17 October 2025 |
104.00 (0.1%) |
103.90 |
102.41 - 104.00 |
3.1806 times |
Thu 16 October 2025 |
103.90 (-0.09%) |
102.60 |
102.60 - 103.90 |
0.7428 times |
Wed 15 October 2025 |
103.99 (1.9%) |
103.99 |
103.99 - 103.99 |
0.0002 times |
Tue 14 October 2025 |
102.05 (-1.88%) |
101.40 |
101.40 - 102.05 |
0.0639 times |
Mon 13 October 2025 |
104.00 (0.97%) |
102.00 |
102.00 - 104.00 |
0.318 times |
Fri 10 October 2025 |
103.00 (0%) |
102.00 |
102.00 - 104.00 |
4.0209 times |
Thu 09 October 2025 |
103.00 (0.24%) |
100.70 |
100.70 - 103.00 |
1.4467 times |
Wed 08 October 2025 |
102.75 (0%) |
102.75 |
102.75 - 102.75 |
0.0002 times |
Tue 07 October 2025 |
102.75 (-0.24%) |
103.00 |
102.70 - 103.00 |
0.5985 times |
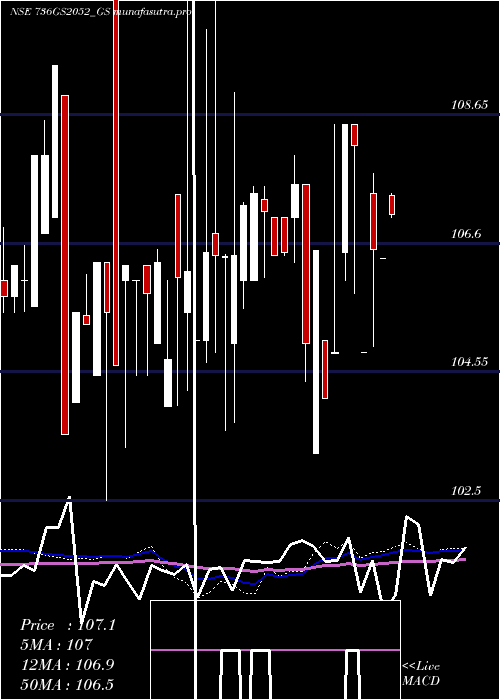
Weekly price and charts GoiLoan Strong weekly Stock price targets for GoiLoan 736GS2052_GS are 103.88 and 106.62 | Weekly Target 1 | 101.6 | | Weekly Target 2 | 103.42 | | Weekly Target 3 | 104.33666666667 | | Weekly Target 4 | 106.16 | | Weekly Target 5 | 107.08 |
Weekly price and volumes for Goi Loan
| Date |
Closing |
Open |
Range |
Volume |
Fri 24 October 2025 |
105.25 (1.2%) |
104.00 |
102.51 - 105.25 |
0.0404 times |
Fri 17 October 2025 |
104.00 (0.97%) |
102.00 |
101.40 - 104.00 |
0.7662 times |
Fri 10 October 2025 |
103.00 (0.26%) |
102.73 |
100.70 - 104.00 |
1.1294 times |
Fri 03 October 2025 |
102.73 (1.64%) |
102.08 |
101.00 - 103.75 |
0.1496 times |
Fri 26 September 2025 |
101.07 (0.27%) |
102.50 |
100.75 - 102.50 |
0.3746 times |
Fri 19 September 2025 |
100.80 (-0.2%) |
102.50 |
100.33 - 102.50 |
2.2629 times |
Fri 12 September 2025 |
101.00 (-3.81%) |
105.00 |
100.55 - 106.09 |
1.1149 times |
Fri 05 September 2025 |
105.00 (1.39%) |
103.50 |
103.01 - 105.50 |
1.7598 times |
Fri 29 August 2025 |
103.56 (-9.89%) |
109.18 |
102.41 - 109.18 |
2.4021 times |
Wed 20 August 2025 |
114.93 (5%) |
103.99 |
103.99 - 114.93 |
0.0001 times |
Fri 08 August 2025 |
109.46 (3.46%) |
111.09 |
105.00 - 114.72 |
0.0127 times |
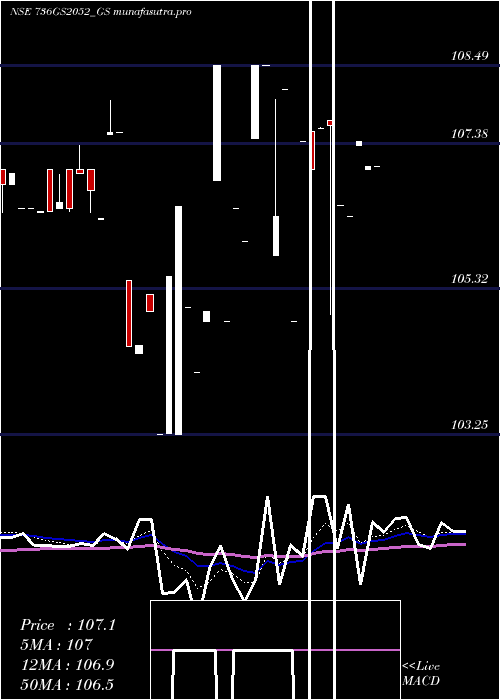
Monthly price and charts GoiLoan Strong monthly Stock price targets for GoiLoan 736GS2052_GS are 102.98 and 107.53 | Monthly Target 1 | 99.18 | | Monthly Target 2 | 102.22 | | Monthly Target 3 | 103.73333333333 | | Monthly Target 4 | 106.77 | | Monthly Target 5 | 108.28 |
Monthly price and volumes Goi Loan
| Date |
Closing |
Open |
Range |
Volume |
Fri 24 October 2025 |
105.25 (2.69%) |
101.00 |
100.70 - 105.25 |
1.2426 times |
Tue 30 September 2025 |
102.49 (-1.03%) |
103.50 |
100.33 - 106.09 |
3.2877 times |
Fri 29 August 2025 |
103.56 (-2.12%) |
111.09 |
102.41 - 114.93 |
1.4399 times |
Thu 31 July 2025 |
105.80 (0.73%) |
105.03 |
104.81 - 110.29 |
1.1715 times |
Mon 30 June 2025 |
105.03 (-1.89%) |
107.00 |
102.31 - 108.79 |
0.5343 times |
Fri 23 May 2025 |
107.05 (2.09%) |
107.40 |
104.96 - 107.70 |
0.1225 times |
Tue 29 April 2025 |
104.86 (-1.52%) |
105.05 |
104.13 - 108.49 |
0.4053 times |
Fri 28 March 2025 |
106.48 (0.02%) |
107.00 |
103.25 - 107.99 |
0.7193 times |
Thu 27 February 2025 |
106.46 (-0.69%) |
106.00 |
106.00 - 107.50 |
0.8371 times |
Fri 31 January 2025 |
107.20 (2.31%) |
105.10 |
103.61 - 110.99 |
0.2398 times |
Mon 30 December 2024 |
104.78 (0.03%) |
107.37 |
104.01 - 113.92 |
0.153 times |
DMA SMA EMA moving averages of Goi Loan 736GS2052_GS
DMA (daily moving average) of Goi Loan 736GS2052_GS
| DMA period | DMA value | | 5 day DMA | 104.23 | | 12 day DMA | 103.47 | | 20 day DMA | 102.77 | | 35 day DMA | 102.75 | | 50 day DMA | 104.28 | | 100 day DMA | 105.45 | | 150 day DMA | 105.75 | | 200 day DMA | 105.84 | EMA (exponential moving average) of Goi Loan 736GS2052_GS
| EMA period | EMA current | EMA prev | EMA prev2 | | 5 day EMA | 104.25 | 103.75 | 103.63 | | 12 day EMA | 103.6 | 103.3 | 103.17 | | 20 day EMA | 103.35 | 103.15 | 103.06 | | 35 day EMA | 103.9 | 103.82 | 103.81 | | 50 day EMA | 104.54 | 104.51 | 104.53 |
SMA (simple moving average) of Goi Loan 736GS2052_GS
| SMA period | SMA current | SMA prev | SMA prev2 | | 5 day SMA | 104.23 | 103.59 | 103.59 | | 12 day SMA | 103.47 | 103.26 | 103.12 | | 20 day SMA | 102.77 | 102.55 | 102.39 | | 35 day SMA | 102.75 | 102.7 | 102.69 | | 50 day SMA | 104.28 | 104.36 | 104.38 | | 100 day SMA | 105.45 | 105.47 | 105.5 | | 150 day SMA | 105.75 | 105.76 | 105.77 | | 200 day SMA | 105.84 | 105.84 | 105.85 |
|
|
