GoiLoan 734GS2064_GS full analysis,charts,indicators,moving averages,SMA,DMA,EMA,ADX,MACD,RSIGoi Loan 734GS2064_GS WideScreen charts, DMA,SMA,EMA technical analysis, forecast prediction, by indicators ADX,MACD,RSI,CCI NSE stock exchange
Daily price and charts and targets GoiLoan Strong Daily Stock price targets for GoiLoan 734GS2064_GS are 101.24 and 101.59 | Daily Target 1 | 101.18 | | Daily Target 2 | 101.3 | | Daily Target 3 | 101.52666666667 | | Daily Target 4 | 101.65 | | Daily Target 5 | 101.88 |
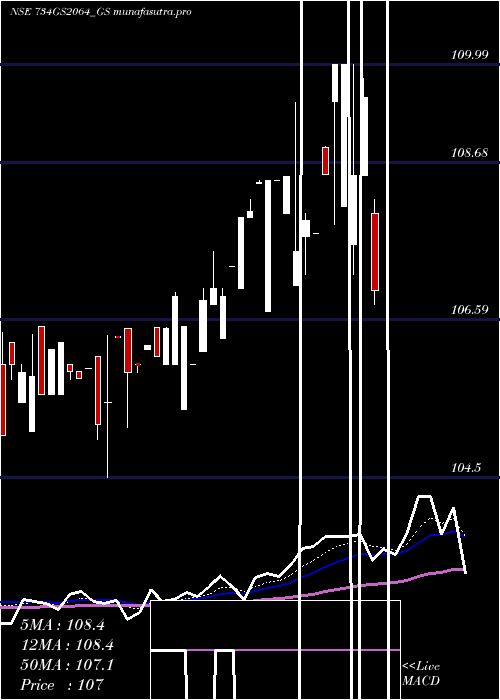
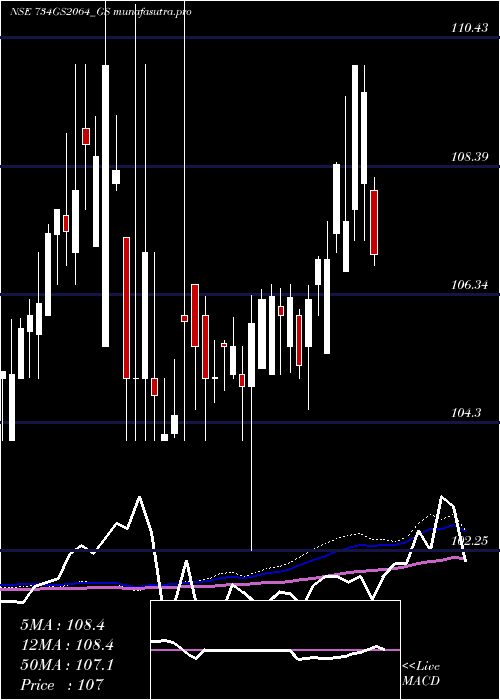
Daily price and volume Goi Loan
| Date |
Closing |
Open |
Range |
Volume |
Wed 29 October 2025 |
101.43 (-0.02%) |
101.51 |
101.40 - 101.75 |
0.3876 times |
Tue 28 October 2025 |
101.45 (-1.01%) |
102.49 |
101.35 - 102.89 |
1.0155 times |
Mon 27 October 2025 |
102.49 (0.14%) |
102.55 |
102.00 - 103.00 |
1.2798 times |
Fri 24 October 2025 |
102.35 (0.35%) |
103.00 |
101.90 - 103.00 |
6.511 times |
Thu 23 October 2025 |
101.99 (0.01%) |
101.95 |
101.91 - 103.00 |
0.0122 times |
Tue 21 October 2025 |
101.98 (-0.06%) |
103.00 |
101.95 - 103.00 |
0.0958 times |
Mon 20 October 2025 |
102.04 (-3.73%) |
104.88 |
101.90 - 104.88 |
0.392 times |
Fri 17 October 2025 |
105.99 (0.14%) |
105.84 |
105.52 - 106.00 |
0.1005 times |
Thu 16 October 2025 |
105.84 (0.13%) |
105.10 |
105.10 - 105.85 |
0.0119 times |
Wed 15 October 2025 |
105.70 (0.33%) |
104.64 |
104.64 - 105.70 |
0.1938 times |
Tue 14 October 2025 |
105.35 (-0.71%) |
105.00 |
105.00 - 105.50 |
0.0311 times |
Weekly price and charts GoiLoan Strong weekly Stock price targets for GoiLoan 734GS2064_GS are 100.57 and 102.22 | Weekly Target 1 | 100.28 | | Weekly Target 2 | 100.85 | | Weekly Target 3 | 101.92666666667 | | Weekly Target 4 | 102.5 | | Weekly Target 5 | 103.58 |
Weekly price and volumes for Goi Loan
| Date |
Closing |
Open |
Range |
Volume |
Wed 29 October 2025 |
101.43 (-0.9%) |
102.55 |
101.35 - 103.00 |
2.3084 times |
Fri 24 October 2025 |
102.35 (-3.43%) |
104.88 |
101.90 - 104.88 |
6.0325 times |
Fri 17 October 2025 |
105.99 (0.14%) |
106.20 |
104.64 - 106.20 |
0.293 times |
Fri 10 October 2025 |
105.84 (1.19%) |
104.70 |
104.05 - 105.84 |
0.12 times |
Fri 03 October 2025 |
104.60 (0.35%) |
104.00 |
102.75 - 104.60 |
0.043 times |
Fri 26 September 2025 |
104.23 (0.42%) |
103.80 |
103.00 - 104.98 |
0.1435 times |
Fri 19 September 2025 |
103.79 (-0.13%) |
104.15 |
102.20 - 104.25 |
0.1892 times |
Fri 12 September 2025 |
103.93 (-0.35%) |
102.75 |
102.75 - 104.75 |
0.3129 times |
Fri 05 September 2025 |
104.30 (1.3%) |
103.40 |
102.21 - 104.30 |
0.2819 times |
Fri 29 August 2025 |
102.96 (-0.47%) |
103.40 |
102.70 - 103.75 |
0.2756 times |
Fri 22 August 2025 |
103.45 (-1.2%) |
104.71 |
103.10 - 104.71 |
0.4162 times |
Monthly price and charts GoiLoan Strong monthly Stock price targets for GoiLoan 734GS2064_GS are 98.97 and 103.82 | Monthly Target 1 | 98.14 | | Monthly Target 2 | 99.79 | | Monthly Target 3 | 102.99333333333 | | Monthly Target 4 | 104.64 | | Monthly Target 5 | 107.84 |
Monthly price and volumes Goi Loan
| Date |
Closing |
Open |
Range |
Volume |
Wed 29 October 2025 |
101.43 (-2.38%) |
104.30 |
101.35 - 106.20 |
3.4497 times |
Tue 30 September 2025 |
103.90 (0.91%) |
103.40 |
102.20 - 104.98 |
0.3725 times |
Fri 29 August 2025 |
102.96 (-1.94%) |
105.75 |
102.70 - 105.80 |
0.5387 times |
Thu 31 July 2025 |
105.00 (0.24%) |
105.34 |
104.00 - 105.99 |
0.3505 times |
Mon 30 June 2025 |
104.75 (-3.02%) |
107.25 |
104.30 - 109.45 |
2.1191 times |
Fri 30 May 2025 |
108.01 (0.33%) |
107.99 |
106.53 - 108.50 |
0.6311 times |
Wed 30 April 2025 |
107.66 (-0.7%) |
106.70 |
106.02 - 109.99 |
0.5895 times |
Fri 28 March 2025 |
108.42 (3.06%) |
105.50 |
104.50 - 108.45 |
0.1795 times |
Fri 28 February 2025 |
105.20 (-1%) |
105.06 |
105.00 - 106.50 |
0.1064 times |
Fri 31 January 2025 |
106.26 (1.15%) |
105.05 |
102.25 - 106.41 |
1.663 times |
Tue 31 December 2024 |
105.05 (0.62%) |
106.00 |
104.00 - 111.18 |
0.7943 times |

DMA SMA EMA moving averages of Goi Loan 734GS2064_GS
DMA (daily moving average) of Goi Loan 734GS2064_GS
| DMA period | DMA value | | 5 day DMA | 101.94 | | 12 day DMA | 103.56 | | 20 day DMA | 104.08 | | 35 day DMA | 104.03 | | 50 day DMA | 103.8 | | 100 day DMA | 104.56 | | 150 day DMA | 105.67 | | 200 day DMA | 105.69 | EMA (exponential moving average) of Goi Loan 734GS2064_GS
| EMA period | EMA current | EMA prev | EMA prev2 | | 5 day EMA | 102.02 | 102.31 | 102.74 | | 12 day EMA | 102.97 | 103.25 | 103.58 | | 20 day EMA | 103.45 | 103.66 | 103.89 | | 35 day EMA | 103.71 | 103.84 | 103.98 | | 50 day EMA | 103.66 | 103.75 | 103.84 |
SMA (simple moving average) of Goi Loan 734GS2064_GS
| SMA period | SMA current | SMA prev | SMA prev2 | | 5 day SMA | 101.94 | 102.05 | 102.17 | | 12 day SMA | 103.56 | 103.93 | 104.22 | | 20 day SMA | 104.08 | 104.22 | 104.36 | | 35 day SMA | 104.03 | 104.09 | 104.17 | | 50 day SMA | 103.8 | 103.87 | 103.92 | | 100 day SMA | 104.56 | 104.63 | 104.69 | | 150 day SMA | 105.67 | 105.7 | 105.74 | | 200 day SMA | 105.69 | 105.7 | 105.72 |
|
|
