GoiLoan 733GS2026_GS full analysis,charts,indicators,moving averages,SMA,DMA,EMA,ADX,MACD,RSIGoi Loan 733GS2026_GS WideScreen charts, DMA,SMA,EMA technical analysis, forecast prediction, by indicators ADX,MACD,RSI,CCI NSE stock exchange
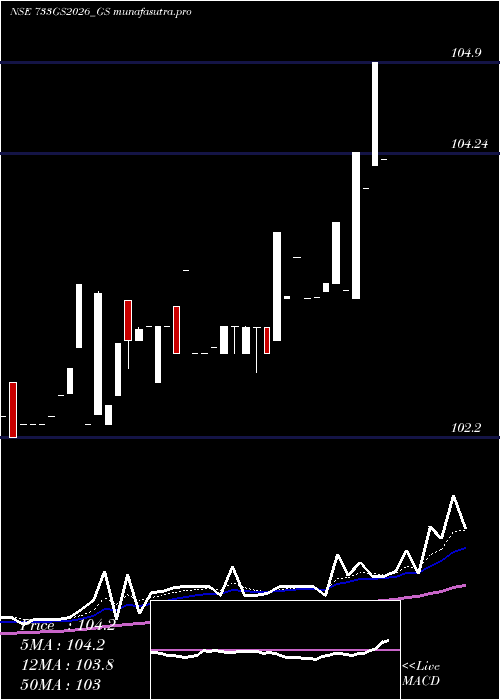
Daily price and charts and targets GoiLoan Strong Daily Stock price targets for GoiLoan 733GS2026_GS are 103.67 and 104.33 | Daily Target 1 | 103.12 | | Daily Target 2 | 103.56 | | Daily Target 3 | 103.78 | | Daily Target 4 | 104.22 | | Daily Target 5 | 104.44 |
Daily price and volume Goi Loan
| Date |
Closing |
Open |
Range |
Volume |
Tue 28 October 2025 |
104.00 (0.64%) |
103.34 |
103.34 - 104.00 |
0.916 times |
Mon 27 October 2025 |
103.34 (-1.49%) |
103.85 |
102.81 - 103.85 |
0.2082 times |
Fri 24 October 2025 |
104.90 (0.38%) |
104.50 |
104.50 - 105.00 |
4.828 times |
Thu 23 October 2025 |
104.50 (0%) |
104.30 |
104.30 - 104.50 |
0.4164 times |
Tue 21 October 2025 |
104.50 (0.19%) |
104.30 |
104.30 - 104.50 |
1.0076 times |
Mon 20 October 2025 |
104.30 (0.47%) |
104.30 |
104.30 - 104.30 |
0.1665 times |
Fri 17 October 2025 |
103.81 (-0.66%) |
103.75 |
103.75 - 103.81 |
0.6662 times |
Thu 16 October 2025 |
104.50 (0.66%) |
104.50 |
104.50 - 104.50 |
0.4996 times |
Wed 15 October 2025 |
103.81 (-0.03%) |
104.00 |
103.81 - 104.00 |
0.5829 times |
Tue 14 October 2025 |
103.84 (-0.35%) |
103.72 |
103.72 - 104.60 |
0.7086 times |
Mon 13 October 2025 |
104.20 (0.43%) |
104.05 |
104.05 - 104.20 |
8.6602 times |
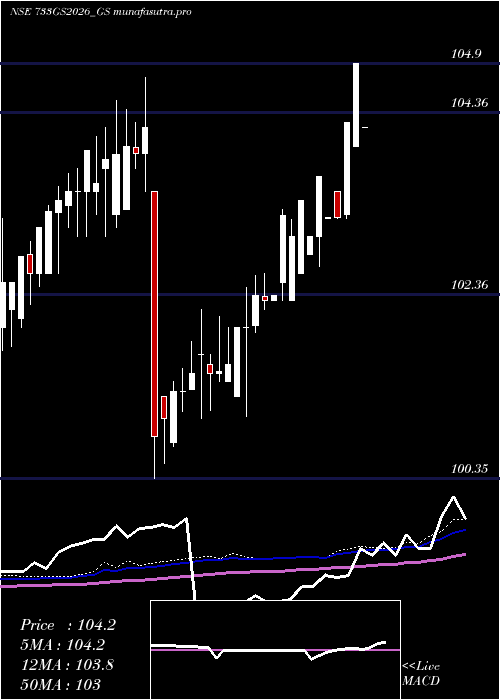
Weekly price and charts GoiLoan Strong weekly Stock price targets for GoiLoan 733GS2026_GS are 103.41 and 104.6 | Weekly Target 1 | 102.41 | | Weekly Target 2 | 103.21 | | Weekly Target 3 | 103.60333333333 | | Weekly Target 4 | 104.4 | | Weekly Target 5 | 104.79 |
Weekly price and volumes for Goi Loan
| Date |
Closing |
Open |
Range |
Volume |
Tue 28 October 2025 |
104.00 (-0.86%) |
103.85 |
102.81 - 104.00 |
0.0059 times |
Fri 24 October 2025 |
104.90 (1.05%) |
104.30 |
104.30 - 105.00 |
0.0338 times |
Fri 17 October 2025 |
103.81 (0.06%) |
104.05 |
103.72 - 104.60 |
0.0585 times |
Fri 10 October 2025 |
103.75 (-0.35%) |
103.76 |
103.71 - 104.77 |
9.4425 times |
Fri 03 October 2025 |
104.11 (0.49%) |
103.60 |
103.60 - 104.55 |
0.0143 times |
Fri 26 September 2025 |
103.60 (-0.17%) |
104.65 |
103.60 - 104.65 |
0.0734 times |
Fri 19 September 2025 |
103.78 (-0.21%) |
104.00 |
103.60 - 104.25 |
0.0182 times |
Fri 12 September 2025 |
104.00 (0.45%) |
103.50 |
103.41 - 104.35 |
0.0561 times |
Wed 03 September 2025 |
103.53 (-0.45%) |
104.00 |
103.41 - 104.10 |
0.0164 times |
Fri 29 August 2025 |
104.00 (1.32%) |
103.80 |
103.25 - 105.00 |
0.2807 times |
Fri 22 August 2025 |
102.65 (-0.63%) |
102.70 |
102.65 - 103.40 |
0.0465 times |
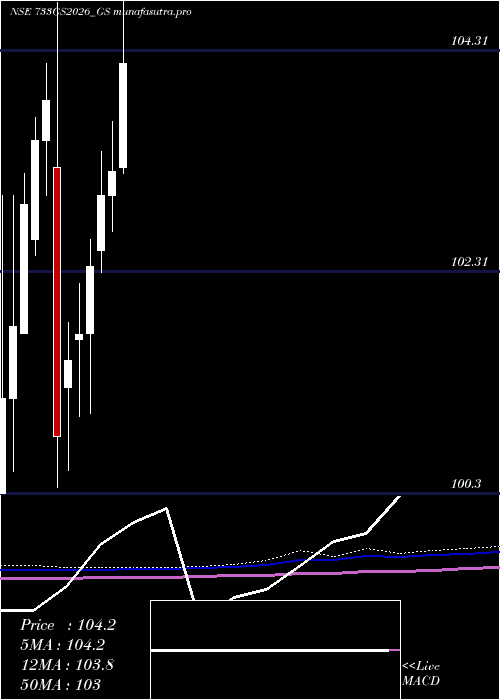
Monthly price and charts GoiLoan Strong monthly Stock price targets for GoiLoan 733GS2026_GS are 102.31 and 104.5 | Monthly Target 1 | 101.75 | | Monthly Target 2 | 102.87 | | Monthly Target 3 | 103.93666666667 | | Monthly Target 4 | 105.06 | | Monthly Target 5 | 106.13 |
Monthly price and volumes Goi Loan
| Date |
Closing |
Open |
Range |
Volume |
Tue 28 October 2025 |
104.00 (-0.48%) |
104.20 |
102.81 - 105.00 |
7.0037 times |
Tue 30 September 2025 |
104.50 (0.48%) |
104.00 |
103.41 - 104.65 |
0.121 times |
Fri 29 August 2025 |
104.00 (0.98%) |
103.20 |
102.65 - 105.00 |
0.2691 times |
Thu 31 July 2025 |
102.99 (-0.09%) |
103.39 |
102.40 - 103.70 |
0.0481 times |
Fri 27 June 2025 |
103.08 (1.04%) |
102.05 |
102.03 - 104.98 |
0.6914 times |
Fri 30 May 2025 |
102.02 (0.32%) |
100.86 |
100.86 - 102.70 |
0.6305 times |
Wed 30 April 2025 |
101.69 (-1.47%) |
103.25 |
101.01 - 105.50 |
0.2657 times |
Wed 26 March 2025 |
103.21 (0.2%) |
103.00 |
102.67 - 103.67 |
0.4785 times |
Fri 28 February 2025 |
103.00 (0.64%) |
102.50 |
102.30 - 103.40 |
0.1919 times |
Fri 31 January 2025 |
102.35 (0.6%) |
101.75 |
101.02 - 102.60 |
0.3002 times |
Tue 31 December 2024 |
101.74 (0.24%) |
101.70 |
101.00 - 102.20 |
0.2402 times |
DMA SMA EMA moving averages of Goi Loan 733GS2026_GS
DMA (daily moving average) of Goi Loan 733GS2026_GS
| DMA period | DMA value | | 5 day DMA | 104.25 | | 12 day DMA | 104.12 | | 20 day DMA | 104.14 | | 35 day DMA | 103.98 | | 50 day DMA | 103.78 | | 100 day DMA | 103.3 | | 150 day DMA | 103.18 | | 200 day DMA | 102.83 | EMA (exponential moving average) of Goi Loan 733GS2026_GS
| EMA period | EMA current | EMA prev | EMA prev2 | | 5 day EMA | 104.09 | 104.13 | 104.52 | | 12 day EMA | 104.14 | 104.16 | 104.31 | | 20 day EMA | 104.08 | 104.09 | 104.17 | | 35 day EMA | 103.93 | 103.93 | 103.97 | | 50 day EMA | 103.79 | 103.78 | 103.8 |
SMA (simple moving average) of Goi Loan 733GS2026_GS
| SMA period | SMA current | SMA prev | SMA prev2 | | 5 day SMA | 104.25 | 104.31 | 104.4 | | 12 day SMA | 104.12 | 104.1 | 104.2 | | 20 day SMA | 104.14 | 104.12 | 104.18 | | 35 day SMA | 103.98 | 103.98 | 104 | | 50 day SMA | 103.78 | 103.76 | 103.76 | | 100 day SMA | 103.3 | 103.28 | 103.27 | | 150 day SMA | 103.18 | 103.17 | 103.16 | | 200 day SMA | 102.83 | 102.81 | 102.8 |
|
|
