TaxFree 732IRFC25_NI full analysis,charts,indicators,moving averages,SMA,DMA,EMA,ADX,MACD,RSITax Free 732IRFC25_NI WideScreen charts, DMA,SMA,EMA technical analysis, forecast prediction, by indicators ADX,MACD,RSI,CCI NSE stock exchange
Daily price and charts and targets TaxFree Strong Daily Stock price targets for TaxFree 732IRFC25_NI are 1005.06 and 1010.95 | Daily Target 1 | 1000.15 | | Daily Target 2 | 1004.07 | | Daily Target 3 | 1006.0366666667 | | Daily Target 4 | 1009.96 | | Daily Target 5 | 1011.93 |
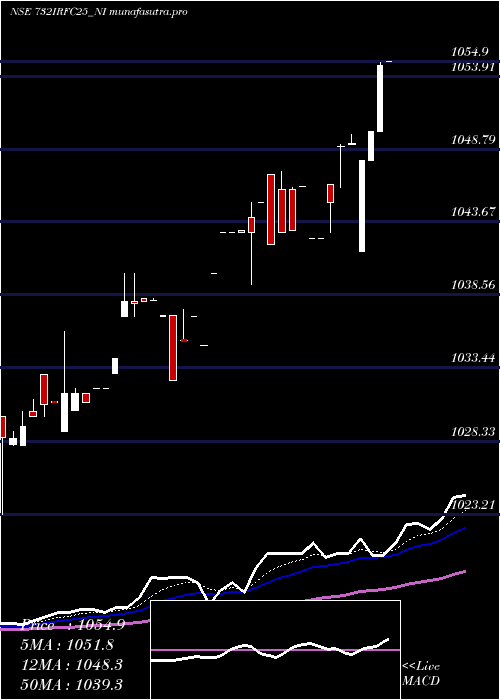
Daily price and volume Tax Free
| Date |
Closing |
Open |
Range |
Volume |
Tue 28 October 2025 |
1008.00 (0.5%) |
1007.40 |
1002.11 - 1008.00 |
2.6104 times |
Mon 27 October 2025 |
1003.00 (0%) |
1003.00 |
1003.00 - 1003.00 |
2.3319 times |
Fri 24 October 2025 |
1003.00 (-0.2%) |
1009.00 |
1003.00 - 1009.00 |
0.1681 times |
Thu 23 October 2025 |
1005.00 (0.1%) |
1003.00 |
1003.00 - 1009.00 |
0.6592 times |
Tue 21 October 2025 |
1004.00 (0%) |
1004.00 |
1004.00 - 1004.00 |
0.033 times |
Mon 20 October 2025 |
1004.00 (-0.5%) |
1005.50 |
1003.50 - 1005.50 |
1.4881 times |
Fri 17 October 2025 |
1009.00 (0.55%) |
1003.50 |
1003.50 - 1009.00 |
0.412 times |
Thu 16 October 2025 |
1003.50 (-0.05%) |
1003.50 |
1003.50 - 1005.05 |
0.2554 times |
Wed 15 October 2025 |
1004.05 (-0.01%) |
1000.00 |
1000.00 - 1023.99 |
1.1338 times |
Tue 14 October 2025 |
1004.19 (-1.45%) |
1025.00 |
998.50 - 1025.00 |
0.908 times |
Mon 13 October 2025 |
1019.00 (2.9%) |
990.25 |
990.25 - 1030.00 |
0.3148 times |
Weekly price and charts TaxFree Strong weekly Stock price targets for TaxFree 732IRFC25_NI are 1005.06 and 1010.95 | Weekly Target 1 | 1000.15 | | Weekly Target 2 | 1004.07 | | Weekly Target 3 | 1006.0366666667 | | Weekly Target 4 | 1009.96 | | Weekly Target 5 | 1011.93 |
Weekly price and volumes for Tax Free
| Date |
Closing |
Open |
Range |
Volume |
Tue 28 October 2025 |
1008.00 (0.5%) |
1003.00 |
1002.11 - 1008.00 |
2.6446 times |
Fri 24 October 2025 |
1003.00 (-0.59%) |
1005.50 |
1003.00 - 1009.00 |
1.2566 times |
Fri 17 October 2025 |
1009.00 (1.89%) |
990.25 |
990.25 - 1030.00 |
1.6182 times |
Fri 10 October 2025 |
990.25 (-6.73%) |
1074.00 |
990.25 - 1074.00 |
0.1764 times |
Fri 19 September 2025 |
1061.71 (0.72%) |
1079.90 |
1061.71 - 1079.90 |
0.425 times |
Wed 10 September 2025 |
1054.11 (-1.39%) |
1067.14 |
1054.11 - 1070.00 |
1.1658 times |
Fri 29 August 2025 |
1068.95 (0%) |
1068.95 |
1068.95 - 1068.95 |
0.0882 times |
Fri 22 August 2025 |
1068.95 (0.51%) |
1064.00 |
1060.14 - 1069.50 |
1.1684 times |
Thu 14 August 2025 |
1063.50 (0.06%) |
1065.00 |
1062.00 - 1065.00 |
0.9189 times |
Fri 08 August 2025 |
1062.90 (0.07%) |
1062.11 |
1062.11 - 1072.88 |
0.5379 times |
Thu 31 July 2025 |
1062.11 (-0.32%) |
1061.33 |
1061.00 - 1065.50 |
1.1287 times |

Monthly price and charts TaxFree Strong monthly Stock price targets for TaxFree 732IRFC25_NI are 999.13 and 1038.88 | Monthly Target 1 | 969.67 | | Monthly Target 2 | 988.83 | | Monthly Target 3 | 1009.4166666667 | | Monthly Target 4 | 1028.58 | | Monthly Target 5 | 1049.17 |
Monthly price and volumes Tax Free
| Date |
Closing |
Open |
Range |
Volume |
Tue 28 October 2025 |
1008.00 (-6.15%) |
990.25 |
990.25 - 1030.00 |
1.4219 times |
Tue 23 September 2025 |
1074.00 (0.47%) |
1067.14 |
1054.11 - 1079.90 |
0.4258 times |
Fri 29 August 2025 |
1068.95 (0.64%) |
1062.11 |
1060.14 - 1072.88 |
0.688 times |
Thu 31 July 2025 |
1062.11 (0.1%) |
1060.00 |
1034.67 - 1065.50 |
0.5836 times |
Mon 30 June 2025 |
1061.00 (0.95%) |
1052.00 |
1045.10 - 1069.85 |
1.6098 times |
Fri 30 May 2025 |
1051.00 (0.77%) |
1046.15 |
1041.60 - 1055.60 |
0.5293 times |
Wed 30 April 2025 |
1043.02 (0.57%) |
1037.15 |
1032.50 - 1047.20 |
1.659 times |
Fri 28 March 2025 |
1037.15 (0.84%) |
1028.00 |
1028.00 - 1040.00 |
1.813 times |
Fri 28 February 2025 |
1028.53 (0.05%) |
1025.22 |
1020.00 - 1034.28 |
0.4696 times |
Fri 31 January 2025 |
1028.00 (-0.13%) |
1029.79 |
1019.30 - 1035.00 |
0.8001 times |
Tue 31 December 2024 |
1029.29 (1.5%) |
1021.00 |
1000.00 - 1029.94 |
2.2207 times |

DMA SMA EMA moving averages of Tax Free 732IRFC25_NI
DMA (daily moving average) of Tax Free 732IRFC25_NI
| DMA period | DMA value | | 5 day DMA | 1004.6 | | 12 day DMA | 1004.75 | | 20 day DMA | 1029.51 | | 35 day DMA | 1044.47 | | 50 day DMA | 1049.58 | | 100 day DMA | 1047.07 | | 150 day DMA | 1039.98 | | 200 day DMA | 1039.21 | EMA (exponential moving average) of Tax Free 732IRFC25_NI
| EMA period | EMA current | EMA prev | EMA prev2 | | 5 day EMA | 1005.73 | 1004.59 | 1005.38 | | 12 day EMA | 1013.25 | 1014.2 | 1016.23 | | 20 day EMA | 1023.11 | 1024.7 | 1026.98 | | 35 day EMA | 1034.4 | 1035.95 | 1037.89 | | 50 day EMA | 1045.51 | 1047.04 | 1048.84 |
SMA (simple moving average) of Tax Free 732IRFC25_NI
| SMA period | SMA current | SMA prev | SMA prev2 | | 5 day SMA | 1004.6 | 1003.8 | 1005 | | 12 day SMA | 1004.75 | 1010.25 | 1015.14 | | 20 day SMA | 1029.51 | 1032.56 | 1035.76 | | 35 day SMA | 1044.47 | 1045.99 | 1047.71 | | 50 day SMA | 1049.58 | 1050.46 | 1051.49 | | 100 day SMA | 1047.07 | 1047.3 | 1047.57 | | 150 day SMA | 1039.98 | 1040.06 | 1040.18 | | 200 day SMA | 1039.21 | 1039.57 | 1039.95 |
|
|
