GoiLoan 732GS2030_GS full analysis,charts,indicators,moving averages,SMA,DMA,EMA,ADX,MACD,RSIGoi Loan 732GS2030_GS WideScreen charts, DMA,SMA,EMA technical analysis, forecast prediction, by indicators ADX,MACD,RSI,CCI NSE stock exchange
Daily price and charts and targets GoiLoan Strong Daily Stock price targets for GoiLoan 732GS2030_GS are 106.65 and 106.65 | Daily Target 1 | 106.65 | | Daily Target 2 | 106.65 | | Daily Target 3 | 106.65 | | Daily Target 4 | 106.65 | | Daily Target 5 | 106.65 |
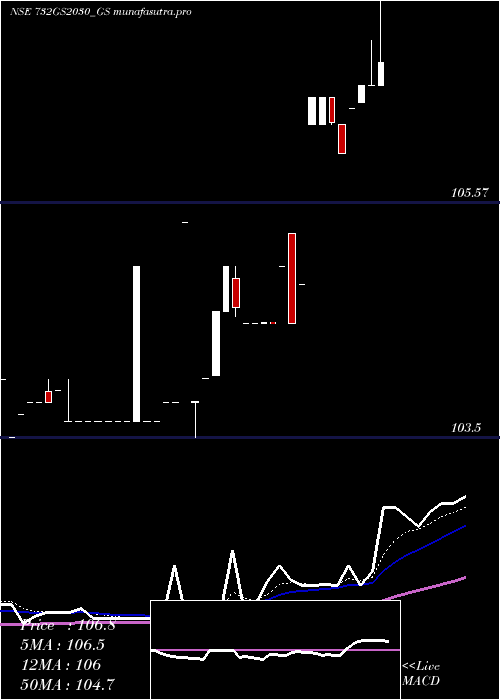
Daily price and volume Goi Loan
| Date |
Closing |
Open |
Range |
Volume |
Wed 29 October 2025 |
106.65 (-1.2%) |
106.65 |
106.65 - 106.65 |
0.0574 times |
Tue 28 October 2025 |
107.95 (1.55%) |
106.65 |
106.65 - 108.20 |
0.9206 times |
Mon 27 October 2025 |
106.30 (-0.19%) |
106.30 |
106.30 - 106.30 |
0.0574 times |
Fri 24 October 2025 |
106.50 (0%) |
106.30 |
106.30 - 106.50 |
0.2296 times |
Thu 23 October 2025 |
106.50 (0.19%) |
106.50 |
106.50 - 106.50 |
0.0281 times |
Tue 21 October 2025 |
106.30 (-0.19%) |
106.30 |
106.30 - 106.30 |
0.1722 times |
Mon 20 October 2025 |
106.50 (-0.05%) |
106.30 |
106.30 - 106.50 |
1.5899 times |
Fri 17 October 2025 |
106.55 (0%) |
106.55 |
106.55 - 106.55 |
4.0177 times |
Thu 16 October 2025 |
106.55 (0.47%) |
106.55 |
106.55 - 106.55 |
2.8698 times |
Wed 15 October 2025 |
106.05 (0.05%) |
106.05 |
106.05 - 106.05 |
0.0574 times |
Tue 14 October 2025 |
106.00 (0.33%) |
106.00 |
106.00 - 106.00 |
0.0947 times |
Weekly price and charts GoiLoan Strong weekly Stock price targets for GoiLoan 732GS2030_GS are 106.48 and 108.38 | Weekly Target 1 | 105.15 | | Weekly Target 2 | 105.9 | | Weekly Target 3 | 107.05 | | Weekly Target 4 | 107.8 | | Weekly Target 5 | 108.95 |
Weekly price and volumes for Goi Loan
| Date |
Closing |
Open |
Range |
Volume |
Wed 29 October 2025 |
106.65 (0.14%) |
106.30 |
106.30 - 108.20 |
0.2635 times |
Fri 24 October 2025 |
106.50 (-0.05%) |
106.30 |
106.30 - 106.50 |
0.5141 times |
Fri 17 October 2025 |
106.55 (0.85%) |
106.00 |
106.00 - 106.55 |
1.7917 times |
Fri 10 October 2025 |
105.65 (-0.33%) |
106.00 |
105.65 - 107.89 |
1.4829 times |
Fri 03 October 2025 |
106.00 (0.57%) |
105.40 |
105.40 - 106.00 |
0.2892 times |
Fri 26 September 2025 |
105.40 (0.24%) |
105.25 |
105.10 - 105.75 |
1.2563 times |
Fri 19 September 2025 |
105.15 (-0.43%) |
106.66 |
105.10 - 106.66 |
1.0518 times |
Fri 12 September 2025 |
105.60 (0.48%) |
105.10 |
105.10 - 106.15 |
0.5712 times |
Fri 05 September 2025 |
105.10 (1.06%) |
105.10 |
105.10 - 105.10 |
0.5148 times |
Fri 29 August 2025 |
104.00 (-0.95%) |
104.85 |
104.00 - 106.40 |
2.2643 times |
Fri 22 August 2025 |
105.00 (-0.14%) |
104.85 |
104.85 - 105.00 |
0.3214 times |

Monthly price and charts GoiLoan Strong monthly Stock price targets for GoiLoan 732GS2030_GS are 106.15 and 108.7 | Monthly Target 1 | 104.28 | | Monthly Target 2 | 105.47 | | Monthly Target 3 | 106.83333333333 | | Monthly Target 4 | 108.02 | | Monthly Target 5 | 109.38 |
Monthly price and volumes Goi Loan
| Date |
Closing |
Open |
Range |
Volume |
Wed 29 October 2025 |
106.65 (0.95%) |
105.65 |
105.65 - 108.20 |
0.5597 times |
Tue 30 September 2025 |
105.65 (1.59%) |
105.10 |
105.10 - 106.66 |
0.4817 times |
Fri 29 August 2025 |
104.00 (-1.89%) |
106.00 |
104.00 - 107.25 |
0.4941 times |
Thu 31 July 2025 |
106.00 (-0.5%) |
105.30 |
105.00 - 107.25 |
0.5909 times |
Fri 27 June 2025 |
106.53 (0.98%) |
105.50 |
104.50 - 107.50 |
1.606 times |
Fri 30 May 2025 |
105.50 (-1.17%) |
106.75 |
104.50 - 109.10 |
1.3252 times |
Wed 30 April 2025 |
106.75 (1.67%) |
105.30 |
104.50 - 108.00 |
1.4168 times |
Wed 26 March 2025 |
105.00 (0%) |
103.64 |
103.50 - 105.39 |
1.5937 times |
Fri 28 February 2025 |
105.00 (0.48%) |
103.65 |
103.50 - 105.00 |
0.7658 times |
Fri 31 January 2025 |
104.50 (1.45%) |
103.55 |
102.00 - 104.50 |
1.1661 times |
Tue 31 December 2024 |
103.01 (0.4%) |
102.60 |
101.90 - 108.00 |
1.911 times |

DMA SMA EMA moving averages of Goi Loan 732GS2030_GS
DMA (daily moving average) of Goi Loan 732GS2030_GS
| DMA period | DMA value | | 5 day DMA | 106.78 | | 12 day DMA | 106.46 | | 20 day DMA | 106.4 | | 35 day DMA | 105.96 | | 50 day DMA | 105.77 | | 100 day DMA | 105.91 | | 150 day DMA | 105.4 | | 200 day DMA | 104.85 | EMA (exponential moving average) of Goi Loan 732GS2030_GS
| EMA period | EMA current | EMA prev | EMA prev2 | | 5 day EMA | 106.83 | 106.92 | 106.4 | | 12 day EMA | 106.6 | 106.59 | 106.34 | | 20 day EMA | 106.41 | 106.38 | 106.22 | | 35 day EMA | 106.17 | 106.14 | 106.03 | | 50 day EMA | 105.9 | 105.87 | 105.78 |
SMA (simple moving average) of Goi Loan 732GS2030_GS
| SMA period | SMA current | SMA prev | SMA prev2 | | 5 day SMA | 106.78 | 106.71 | 106.42 | | 12 day SMA | 106.46 | 106.53 | 106.41 | | 20 day SMA | 106.4 | 106.34 | 106.22 | | 35 day SMA | 105.96 | 105.91 | 105.83 | | 50 day SMA | 105.77 | 105.76 | 105.72 | | 100 day SMA | 105.91 | 105.91 | 105.9 | | 150 day SMA | 105.4 | 105.38 | 105.35 | | 200 day SMA | 104.85 | 104.84 | 104.83 |
|
|
