TaxFree 729NHAI26_NC full analysis,charts,indicators,moving averages,SMA,DMA,EMA,ADX,MACD,RSITax Free 729NHAI26_NC WideScreen charts, DMA,SMA,EMA technical analysis, forecast prediction, by indicators ADX,MACD,RSI,CCI NSE stock exchange
Daily price and charts and targets TaxFree Strong Daily Stock price targets for TaxFree 729NHAI26_NC are 1014.1 and 1019.89 | Daily Target 1 | 1009.27 | | Daily Target 2 | 1013.13 | | Daily Target 3 | 1015.06 | | Daily Target 4 | 1018.92 | | Daily Target 5 | 1020.85 |
Daily price and volume Tax Free
| Date |
Closing |
Open |
Range |
Volume |
Wed 29 October 2025 |
1016.99 (0.54%) |
1011.50 |
1011.20 - 1016.99 |
0.442 times |
Tue 28 October 2025 |
1011.50 (-0.33%) |
1011.50 |
1011.50 - 1011.50 |
0.3929 times |
Fri 24 October 2025 |
1014.89 (0.58%) |
1009.11 |
1009.11 - 1014.89 |
1.0314 times |
Thu 23 October 2025 |
1009.06 (-0.09%) |
1009.00 |
1009.00 - 1009.80 |
1.5472 times |
Tue 21 October 2025 |
1010.00 (0.1%) |
1010.00 |
1010.00 - 1010.00 |
0.0982 times |
Mon 20 October 2025 |
1009.00 (0%) |
1009.40 |
1007.01 - 1009.40 |
0.9528 times |
Fri 17 October 2025 |
1008.98 (-0.1%) |
1008.99 |
1006.55 - 1009.00 |
3.1189 times |
Thu 16 October 2025 |
1010.00 (0%) |
1010.00 |
1010.00 - 1010.00 |
0.0982 times |
Tue 14 October 2025 |
1010.00 (0.58%) |
1010.00 |
1010.00 - 1010.00 |
0.2456 times |
Mon 13 October 2025 |
1004.13 (0.11%) |
1003.00 |
1003.00 - 1010.00 |
2.0727 times |
Fri 10 October 2025 |
1003.00 (-1.38%) |
1010.00 |
1003.00 - 1010.00 |
16.4538 times |
Weekly price and charts TaxFree Strong weekly Stock price targets for TaxFree 729NHAI26_NC are 1014.1 and 1019.89 | Weekly Target 1 | 1009.27 | | Weekly Target 2 | 1013.13 | | Weekly Target 3 | 1015.06 | | Weekly Target 4 | 1018.92 | | Weekly Target 5 | 1020.85 |
Weekly price and volumes for Tax Free
| Date |
Closing |
Open |
Range |
Volume |
Wed 29 October 2025 |
1016.99 (0.21%) |
1011.50 |
1011.20 - 1016.99 |
0.1783 times |
Fri 24 October 2025 |
1014.89 (0.59%) |
1009.40 |
1007.01 - 1014.89 |
0.7752 times |
Fri 17 October 2025 |
1008.98 (0.6%) |
1003.00 |
1003.00 - 1010.00 |
1.1822 times |
Fri 10 October 2025 |
1003.00 (-0.69%) |
1010.00 |
1003.00 - 1017.00 |
3.8057 times |
Fri 03 October 2025 |
1010.00 (-0.54%) |
1015.50 |
1008.00 - 1015.50 |
0.3609 times |
Mon 22 September 2025 |
1015.50 (-0.05%) |
1015.00 |
1015.00 - 1015.99 |
0.0262 times |
Fri 19 September 2025 |
1016.00 (-5.4%) |
1030.00 |
1015.00 - 1030.00 |
0.3199 times |
Tue 09 September 2025 |
1074.00 (-0.12%) |
1075.50 |
1065.00 - 1075.50 |
0.4311 times |
Fri 05 September 2025 |
1075.30 (-0.44%) |
1080.00 |
1074.00 - 1085.00 |
0.0556 times |
Wed 20 August 2025 |
1080.00 (1.41%) |
1075.00 |
1072.00 - 1080.00 |
2.8648 times |
Tue 05 August 2025 |
1065.00 (0.32%) |
1065.00 |
1065.00 - 1065.00 |
0.0073 times |
Monthly price and charts TaxFree Strong monthly Stock price targets for TaxFree 729NHAI26_NC are 1010 and 1024 | Monthly Target 1 | 998.33 | | Monthly Target 2 | 1007.66 | | Monthly Target 3 | 1012.33 | | Monthly Target 4 | 1021.66 | | Monthly Target 5 | 1026.33 |
Monthly price and volumes Tax Free
| Date |
Closing |
Open |
Range |
Volume |
Wed 29 October 2025 |
1016.99 (0.79%) |
1010.01 |
1003.00 - 1017.00 |
2.6401 times |
Mon 29 September 2025 |
1009.00 (-6.57%) |
1074.00 |
1009.00 - 1085.00 |
0.4027 times |
Mon 25 August 2025 |
1080.00 (1.74%) |
1065.00 |
1065.00 - 1080.00 |
1.2261 times |
Fri 18 July 2025 |
1061.55 (-0.23%) |
1059.15 |
1055.00 - 1075.00 |
1.2909 times |
Mon 30 June 2025 |
1064.00 (-0.56%) |
1046.50 |
1046.50 - 1065.00 |
1.1961 times |
Fri 30 May 2025 |
1070.00 (1.61%) |
1052.50 |
1048.02 - 1070.00 |
0.7907 times |
Mon 28 April 2025 |
1053.00 (0.66%) |
1050.00 |
1044.29 - 1059.00 |
0.6573 times |
Fri 28 March 2025 |
1046.10 (0.1%) |
1060.00 |
1040.00 - 1060.00 |
0.1665 times |
Thu 27 February 2025 |
1045.01 (0.08%) |
1044.21 |
1044.21 - 1045.01 |
0.072 times |
Fri 31 January 2025 |
1044.21 (0.7%) |
1030.00 |
1027.01 - 1048.00 |
1.5576 times |
Tue 31 December 2024 |
1037.00 (0.19%) |
1034.95 |
1024.05 - 1040.53 |
0.6752 times |

DMA SMA EMA moving averages of Tax Free 729NHAI26_NC
DMA (daily moving average) of Tax Free 729NHAI26_NC
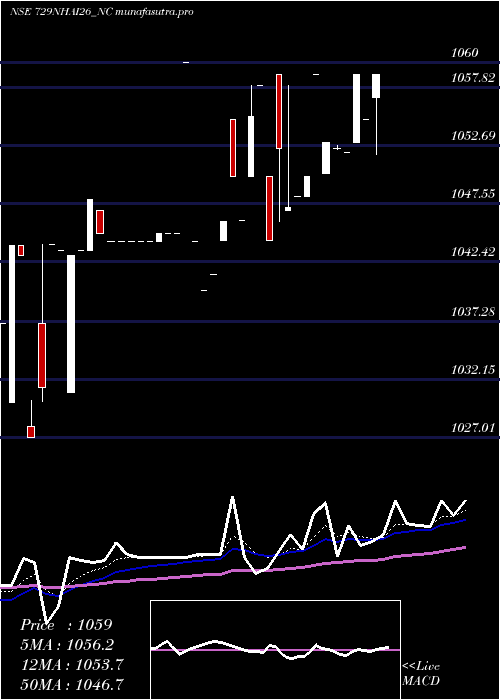
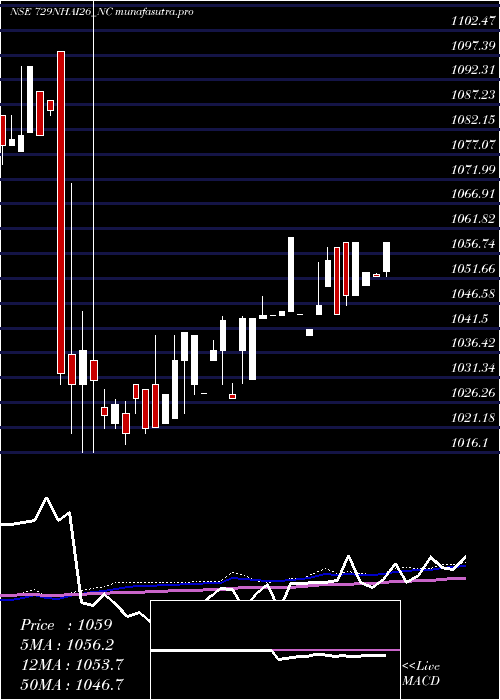
| DMA period | DMA value | | 5 day DMA | 1012.49 | | 12 day DMA | 1010.38 | | 20 day DMA | 1010.95 | | 35 day DMA | 1034.01 | | 50 day DMA | 1042.02 | | 100 day DMA | 1042.42 | | 150 day DMA | 1040.74 | | 200 day DMA | | EMA (exponential moving average) of Tax Free 729NHAI26_NC
| EMA period | EMA current | EMA prev | EMA prev2 | | 5 day EMA | 1013.17 | 1011.26 | 1011.14 | | 12 day EMA | 1013.17 | 1012.48 | 1012.66 | | 20 day EMA | 1017.83 | 1017.92 | 1018.59 | | 35 day EMA | 1027.1 | 1027.69 | 1028.64 | | 50 day EMA | 1040.18 | 1041.13 | 1042.34 |
SMA (simple moving average) of Tax Free 729NHAI26_NC
| SMA period | SMA current | SMA prev | SMA prev2 | | 5 day SMA | 1012.49 | 1010.89 | 1010.39 | | 12 day SMA | 1010.38 | 1009.8 | 1009.67 | | 20 day SMA | 1010.95 | 1011.1 | 1012.03 | | 35 day SMA | 1034.01 | 1035.67 | 1037.23 | | 50 day SMA | 1042.02 | 1042.86 | 1043.67 | | 100 day SMA | 1042.42 | 1042.6 | 1042.79 | | 150 day SMA | 1040.74 | 1041.17 | 1041.63 | | 200 day SMA |
|
|
