GoiLoan 726GS2032_GS full analysis,charts,indicators,moving averages,SMA,DMA,EMA,ADX,MACD,RSIGoi Loan 726GS2032_GS WideScreen charts, DMA,SMA,EMA technical analysis, forecast prediction, by indicators ADX,MACD,RSI,CCI NSE stock exchange
Daily price and charts and targets GoiLoan Strong Daily Stock price targets for GoiLoan 726GS2032_GS are 104.1 and 104.1 | Daily Target 1 | 104.1 | | Daily Target 2 | 104.1 | | Daily Target 3 | 104.1 | | Daily Target 4 | 104.1 | | Daily Target 5 | 104.1 |
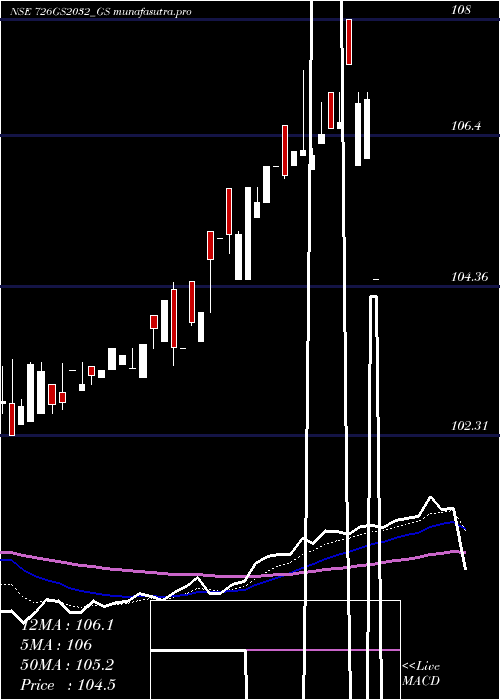
Daily price and volume Goi Loan
| Date |
Closing |
Open |
Range |
Volume |
Tue 28 October 2025 |
104.10 (-1.65%) |
104.10 |
104.10 - 104.10 |
1.2156 times |
Mon 27 October 2025 |
105.85 (0.24%) |
105.85 |
105.85 - 105.85 |
0.1021 times |
Fri 24 October 2025 |
105.60 (0%) |
105.60 |
105.60 - 105.63 |
1.2997 times |
Thu 23 October 2025 |
105.60 (0.57%) |
105.00 |
104.64 - 105.70 |
0.8815 times |
Tue 21 October 2025 |
105.00 (-0.28%) |
105.00 |
105.00 - 105.00 |
0.0608 times |
Mon 20 October 2025 |
105.30 (0.05%) |
105.30 |
105.30 - 105.30 |
0.1823 times |
Fri 17 October 2025 |
105.25 (0.24%) |
104.75 |
104.75 - 105.25 |
5.4033 times |
Thu 16 October 2025 |
105.00 (0%) |
105.00 |
105.00 - 105.00 |
0.6078 times |
Tue 14 October 2025 |
105.00 (0.57%) |
104.61 |
104.61 - 105.50 |
0.1643 times |
Mon 13 October 2025 |
104.40 (0%) |
104.51 |
104.40 - 104.51 |
0.0825 times |
Fri 10 October 2025 |
104.40 (-0.57%) |
104.40 |
104.40 - 104.40 |
0.0122 times |
Weekly price and charts GoiLoan Strong weekly Stock price targets for GoiLoan 726GS2032_GS are 103.23 and 104.98 | Weekly Target 1 | 102.93 | | Weekly Target 2 | 103.52 | | Weekly Target 3 | 104.68333333333 | | Weekly Target 4 | 105.27 | | Weekly Target 5 | 106.43 |
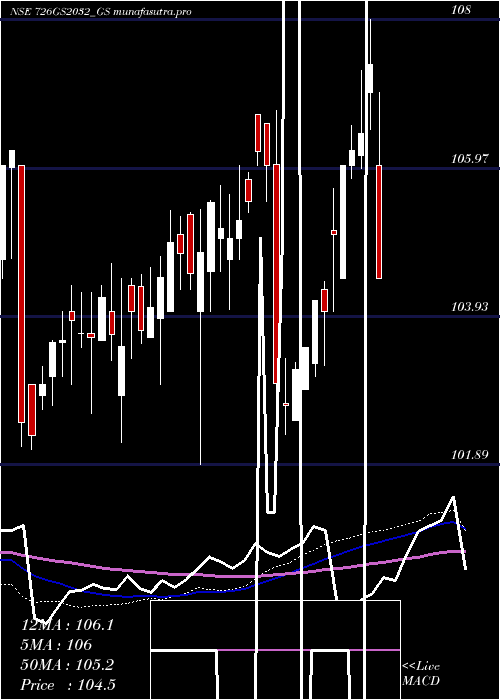
Weekly price and volumes for Goi Loan
| Date |
Closing |
Open |
Range |
Volume |
Tue 28 October 2025 |
104.10 (-1.42%) |
105.85 |
104.10 - 105.85 |
0.253 times |
Fri 24 October 2025 |
105.60 (0.33%) |
105.30 |
104.64 - 105.70 |
0.4655 times |
Fri 17 October 2025 |
105.25 (0.81%) |
104.51 |
104.40 - 105.50 |
1.2016 times |
Fri 10 October 2025 |
104.40 (-0.33%) |
105.00 |
103.25 - 105.40 |
1.8593 times |
Fri 03 October 2025 |
104.75 (0.52%) |
104.21 |
103.90 - 104.75 |
0.1575 times |
Fri 26 September 2025 |
104.21 (0.2%) |
103.70 |
103.70 - 104.85 |
0.7289 times |
Fri 19 September 2025 |
104.00 (-0.08%) |
103.55 |
103.55 - 104.54 |
1.0845 times |
Fri 12 September 2025 |
104.08 (0.05%) |
104.05 |
103.71 - 106.90 |
0.7713 times |
Fri 05 September 2025 |
104.03 (1.09%) |
105.00 |
103.11 - 105.90 |
1.661 times |
Fri 29 August 2025 |
102.91 (-4.72%) |
108.40 |
102.40 - 108.60 |
1.8175 times |
Wed 13 August 2025 |
108.01 (0%) |
108.44 |
108.00 - 108.44 |
0.3627 times |
Monthly price and charts GoiLoan Strong monthly Stock price targets for GoiLoan 726GS2032_GS are 102.38 and 104.98 | Monthly Target 1 | 101.8 | | Monthly Target 2 | 102.95 | | Monthly Target 3 | 104.4 | | Monthly Target 4 | 105.55 | | Monthly Target 5 | 107 |
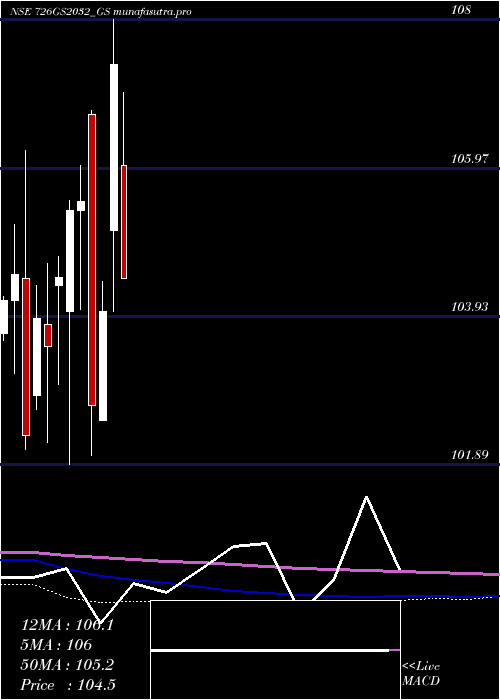
Monthly price and volumes Goi Loan
| Date |
Closing |
Open |
Range |
Volume |
Tue 28 October 2025 |
104.10 (-0.01%) |
104.15 |
103.25 - 105.85 |
0.4992 times |
Tue 30 September 2025 |
104.11 (1.17%) |
105.00 |
103.11 - 106.90 |
0.5518 times |
Fri 29 August 2025 |
102.91 (-5.14%) |
108.38 |
102.40 - 108.60 |
0.3819 times |
Thu 31 July 2025 |
108.49 (1.39%) |
107.25 |
106.65 - 108.85 |
0.6795 times |
Mon 30 June 2025 |
107.00 (-1.16%) |
109.20 |
106.32 - 112.00 |
1.6471 times |
Fri 30 May 2025 |
108.26 (0.82%) |
106.00 |
104.45 - 109.00 |
1.0104 times |
Wed 30 April 2025 |
107.38 (3.25%) |
105.10 |
104.00 - 108.00 |
0.5397 times |
Fri 28 March 2025 |
104.00 (1.26%) |
102.50 |
102.50 - 104.41 |
2.7647 times |
Fri 28 February 2025 |
102.71 (-2.64%) |
106.70 |
102.02 - 106.75 |
1.1128 times |
Fri 31 January 2025 |
105.50 (0.1%) |
105.38 |
104.02 - 106.00 |
0.8129 times |
Tue 31 December 2024 |
105.39 (0.89%) |
104.00 |
101.89 - 105.52 |
5.6927 times |
DMA SMA EMA moving averages of Goi Loan 726GS2032_GS
DMA (daily moving average) of Goi Loan 726GS2032_GS
| DMA period | DMA value | | 5 day DMA | 105.23 | | 12 day DMA | 105.04 | | 20 day DMA | 104.83 | | 35 day DMA | 104.55 | | 50 day DMA | 105.26 | | 100 day DMA | 106.6 | | 150 day DMA | 105.98 | | 200 day DMA | 105.77 | EMA (exponential moving average) of Goi Loan 726GS2032_GS
| EMA period | EMA current | EMA prev | EMA prev2 | | 5 day EMA | 105.05 | 105.52 | 105.35 | | 12 day EMA | 105.03 | 105.2 | 105.08 | | 20 day EMA | 104.99 | 105.08 | 105 | | 35 day EMA | 105.25 | 105.32 | 105.29 | | 50 day EMA | 105.51 | 105.57 | 105.56 |
SMA (simple moving average) of Goi Loan 726GS2032_GS
| SMA period | SMA current | SMA prev | SMA prev2 | | 5 day SMA | 105.23 | 105.47 | 105.35 | | 12 day SMA | 105.04 | 105.1 | 105.07 | | 20 day SMA | 104.83 | 104.86 | 104.79 | | 35 day SMA | 104.55 | 104.55 | 104.47 | | 50 day SMA | 105.26 | 105.35 | 105.39 | | 100 day SMA | 106.6 | 106.63 | 106.61 | | 150 day SMA | 105.98 | 105.99 | 106 | | 200 day SMA | 105.77 | 105.77 | 105.76 |
|
|
