GoiLoan 718GS2037_GS full analysis,charts,indicators,moving averages,SMA,DMA,EMA,ADX,MACD,RSIGoi Loan 718GS2037_GS WideScreen charts, DMA,SMA,EMA technical analysis, forecast prediction, by indicators ADX,MACD,RSI,CCI NSE stock exchange
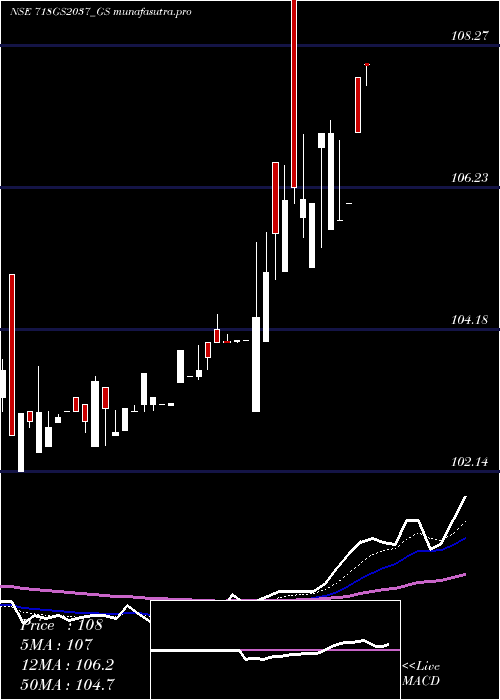
Daily price and charts and targets GoiLoan Strong Daily Stock price targets for GoiLoan 718GS2037_GS are 104.8 and 104.8 | Daily Target 1 | 104.8 | | Daily Target 2 | 104.8 | | Daily Target 3 | 104.8 | | Daily Target 4 | 104.8 | | Daily Target 5 | 104.8 |
Daily price and volume Goi Loan
| Date |
Closing |
Open |
Range |
Volume |
Tue 28 October 2025 |
104.80 (-0.05%) |
104.80 |
104.80 - 104.80 |
0.1298 times |
Mon 27 October 2025 |
104.85 (0.06%) |
105.00 |
104.26 - 105.00 |
0.8438 times |
Fri 24 October 2025 |
104.79 (-0.67%) |
105.50 |
104.51 - 105.50 |
0.4026 times |
Thu 23 October 2025 |
105.50 (0%) |
105.50 |
105.50 - 105.50 |
0.001 times |
Tue 21 October 2025 |
105.50 (0.38%) |
105.50 |
105.50 - 105.50 |
0.0866 times |
Mon 20 October 2025 |
105.10 (1.84%) |
104.11 |
104.11 - 105.49 |
0.2192 times |
Fri 17 October 2025 |
103.20 (-1.94%) |
105.50 |
103.20 - 105.50 |
4.521 times |
Thu 16 October 2025 |
105.24 (0.26%) |
105.00 |
105.00 - 105.24 |
0.0435 times |
Wed 15 October 2025 |
104.97 (-0.3%) |
105.30 |
104.97 - 105.30 |
0.2814 times |
Tue 14 October 2025 |
105.29 (0.32%) |
105.00 |
104.74 - 105.40 |
3.4711 times |
Mon 13 October 2025 |
104.95 (0.17%) |
103.20 |
103.20 - 105.50 |
0.052 times |
Weekly price and charts GoiLoan Strong weekly Stock price targets for GoiLoan 718GS2037_GS are 104.16 and 104.9 | Weekly Target 1 | 103.95 | | Weekly Target 2 | 104.37 | | Weekly Target 3 | 104.68666666667 | | Weekly Target 4 | 105.11 | | Weekly Target 5 | 105.43 |
Weekly price and volumes for Goi Loan
| Date |
Closing |
Open |
Range |
Volume |
Tue 28 October 2025 |
104.80 (0.01%) |
105.00 |
104.26 - 105.00 |
0.0647 times |
Fri 24 October 2025 |
104.79 (1.54%) |
104.11 |
104.11 - 105.50 |
0.0472 times |
Fri 17 October 2025 |
103.20 (-1.5%) |
103.20 |
103.20 - 105.50 |
0.5564 times |
Fri 10 October 2025 |
104.77 (0.17%) |
105.00 |
104.61 - 105.50 |
0.1281 times |
Fri 03 October 2025 |
104.59 (-0.34%) |
105.25 |
104.55 - 105.50 |
0.0995 times |
Fri 26 September 2025 |
104.95 (-0.14%) |
104.99 |
104.11 - 105.77 |
0.8413 times |
Fri 19 September 2025 |
105.10 (0.1%) |
105.00 |
104.90 - 105.49 |
5.2182 times |
Fri 12 September 2025 |
105.00 (0.95%) |
104.00 |
104.00 - 105.85 |
1.9549 times |
Fri 05 September 2025 |
104.01 (0.3%) |
103.00 |
103.00 - 104.24 |
0.9816 times |
Fri 29 August 2025 |
103.70 (0.49%) |
104.00 |
103.00 - 104.00 |
0.108 times |
Fri 22 August 2025 |
103.19 (-0.41%) |
103.50 |
103.00 - 104.74 |
0.2906 times |
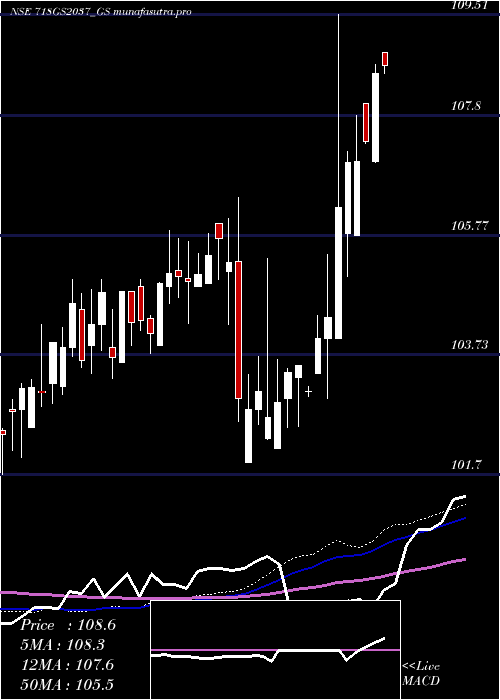
Monthly price and charts GoiLoan Strong monthly Stock price targets for GoiLoan 718GS2037_GS are 102.85 and 105.15 | Monthly Target 1 | 102.2 | | Monthly Target 2 | 103.5 | | Monthly Target 3 | 104.5 | | Monthly Target 4 | 105.8 | | Monthly Target 5 | 106.8 |
Monthly price and volumes Goi Loan
| Date |
Closing |
Open |
Range |
Volume |
Tue 28 October 2025 |
104.80 (0.05%) |
105.50 |
103.20 - 105.50 |
0.2194 times |
Tue 30 September 2025 |
104.75 (1.01%) |
103.00 |
103.00 - 105.85 |
2.4122 times |
Fri 29 August 2025 |
103.70 (-0.98%) |
104.40 |
103.00 - 105.88 |
0.3073 times |
Thu 31 July 2025 |
104.73 (-2.8%) |
107.36 |
104.00 - 109.22 |
1.0214 times |
Mon 30 June 2025 |
107.75 (-1.61%) |
108.70 |
106.76 - 109.68 |
0.5213 times |
Fri 30 May 2025 |
109.51 (1.13%) |
108.65 |
106.07 - 109.70 |
1.2567 times |
Wed 30 April 2025 |
108.29 (3.77%) |
104.01 |
104.01 - 109.51 |
0.4118 times |
Fri 28 March 2025 |
104.36 (0.9%) |
103.35 |
102.51 - 105.43 |
1.0701 times |
Fri 28 February 2025 |
103.43 (0.61%) |
102.80 |
102.14 - 105.36 |
1.2712 times |
Fri 31 January 2025 |
102.80 (-2.84%) |
105.20 |
101.90 - 106.40 |
1.5086 times |
Tue 31 December 2024 |
105.80 (0.82%) |
104.90 |
104.26 - 105.84 |
1.1336 times |

DMA SMA EMA moving averages of Goi Loan 718GS2037_GS
DMA (daily moving average) of Goi Loan 718GS2037_GS
| DMA period | DMA value | | 5 day DMA | 105.09 | | 12 day DMA | 104.91 | | 20 day DMA | 104.84 | | 35 day DMA | 104.87 | | 50 day DMA | 104.53 | | 100 day DMA | 105.75 | | 150 day DMA | 105.97 | | 200 day DMA | 105.5 | EMA (exponential moving average) of Goi Loan 718GS2037_GS
| EMA period | EMA current | EMA prev | EMA prev2 | | 5 day EMA | 104.91 | 104.96 | 105.02 | | 12 day EMA | 104.9 | 104.92 | 104.93 | | 20 day EMA | 104.85 | 104.86 | 104.86 | | 35 day EMA | 104.7 | 104.69 | 104.68 | | 50 day EMA | 104.56 | 104.55 | 104.54 |
SMA (simple moving average) of Goi Loan 718GS2037_GS
| SMA period | SMA current | SMA prev | SMA prev2 | | 5 day SMA | 105.09 | 105.15 | 104.82 | | 12 day SMA | 104.91 | 104.9 | 104.91 | | 20 day SMA | 104.84 | 104.85 | 104.85 | | 35 day SMA | 104.87 | 104.85 | 104.83 | | 50 day SMA | 104.53 | 104.5 | 104.49 | | 100 day SMA | 105.75 | 105.8 | 105.84 | | 150 day SMA | 105.97 | 105.96 | 105.95 | | 200 day SMA | 105.5 | 105.5 | 105.5 |
|
|
