GoiLoan 718GS2033_GS full analysis,charts,indicators,moving averages,SMA,DMA,EMA,ADX,MACD,RSIGoi Loan 718GS2033_GS WideScreen charts, DMA,SMA,EMA technical analysis, forecast prediction, by indicators ADX,MACD,RSI,CCI NSE stock exchange
Daily price and charts and targets GoiLoan Strong Daily Stock price targets for GoiLoan 718GS2033_GS are 103.95 and 104.05 | Daily Target 1 | 103.93 | | Daily Target 2 | 103.97 | | Daily Target 3 | 104.03333333333 | | Daily Target 4 | 104.07 | | Daily Target 5 | 104.13 |
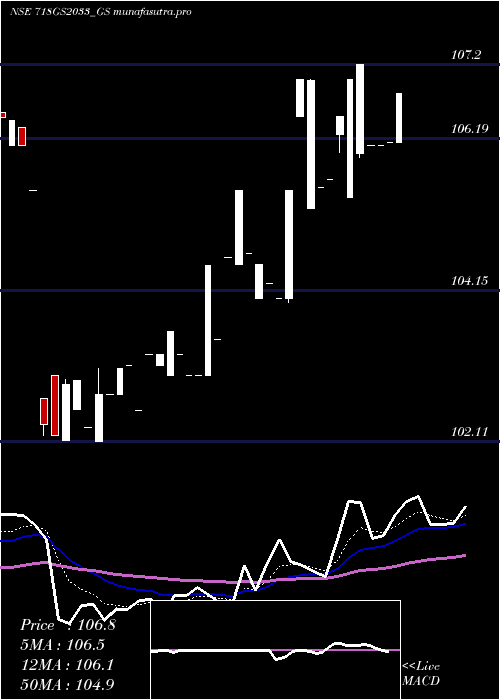
Daily price and volume Goi Loan
| Date |
Closing |
Open |
Range |
Volume |
Tue 28 October 2025 |
104.00 (-0.24%) |
104.10 |
104.00 - 104.10 |
3.8684 times |
Fri 24 October 2025 |
104.25 (0%) |
104.25 |
104.25 - 104.25 |
0.9481 times |
Tue 21 October 2025 |
104.25 (-0.9%) |
104.25 |
104.25 - 104.25 |
0.0316 times |
Mon 20 October 2025 |
105.20 (-0.28%) |
104.25 |
104.25 - 105.20 |
0.6798 times |
Fri 17 October 2025 |
105.50 (0.96%) |
105.50 |
105.50 - 105.50 |
1.8836 times |
Wed 15 October 2025 |
104.50 (0.19%) |
104.15 |
104.15 - 105.15 |
0.5215 times |
Tue 14 October 2025 |
104.30 (-0.19%) |
104.20 |
104.20 - 106.00 |
0.982 times |
Mon 13 October 2025 |
104.50 (0.33%) |
104.50 |
104.50 - 104.50 |
0.2212 times |
Fri 10 October 2025 |
104.16 (0.14%) |
104.16 |
104.16 - 104.16 |
0.0632 times |
Thu 09 October 2025 |
104.01 (-0.29%) |
104.00 |
104.00 - 105.00 |
0.8005 times |
Wed 08 October 2025 |
104.31 (0.26%) |
104.15 |
104.15 - 105.00 |
11.2354 times |
Weekly price and charts GoiLoan Strong weekly Stock price targets for GoiLoan 718GS2033_GS are 103.95 and 104.05 | Weekly Target 1 | 103.93 | | Weekly Target 2 | 103.97 | | Weekly Target 3 | 104.03333333333 | | Weekly Target 4 | 104.07 | | Weekly Target 5 | 104.13 |
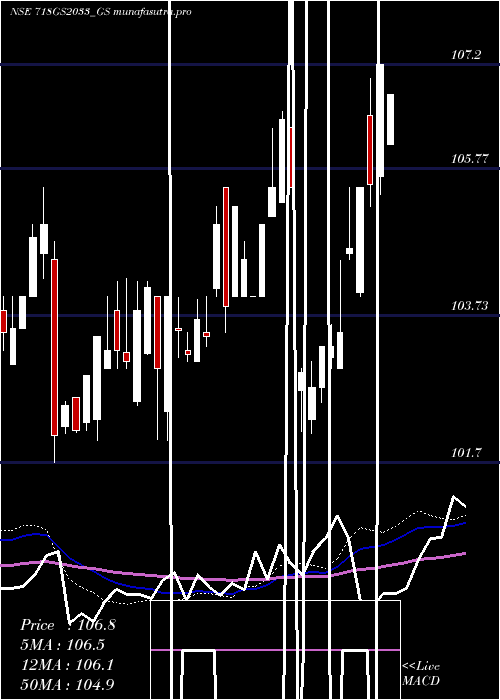
Weekly price and volumes for Goi Loan
| Date |
Closing |
Open |
Range |
Volume |
Tue 28 October 2025 |
104.00 (-0.24%) |
104.10 |
104.00 - 104.10 |
0.7952 times |
Fri 24 October 2025 |
104.25 (-1.18%) |
104.25 |
104.25 - 105.20 |
0.3412 times |
Fri 17 October 2025 |
105.50 (1.29%) |
104.50 |
104.15 - 106.00 |
0.7418 times |
Fri 10 October 2025 |
104.16 (0.64%) |
104.04 |
104.00 - 105.00 |
2.4937 times |
Wed 01 October 2025 |
103.50 (-0.48%) |
103.15 |
103.15 - 104.00 |
0.056 times |
Thu 25 September 2025 |
104.00 (0.48%) |
105.75 |
103.75 - 105.75 |
1.9037 times |
Fri 05 September 2025 |
103.50 (0.83%) |
103.54 |
103.00 - 104.94 |
2.6567 times |
Fri 29 August 2025 |
102.65 (-0.39%) |
102.25 |
102.00 - 102.65 |
0.0767 times |
Thu 21 August 2025 |
103.05 (-4.32%) |
104.50 |
103.00 - 104.50 |
0.7334 times |
Tue 12 August 2025 |
107.70 (-0.78%) |
108.55 |
107.46 - 108.55 |
0.2016 times |
Fri 08 August 2025 |
108.55 (0.97%) |
107.70 |
107.50 - 108.55 |
2.0992 times |
Monthly price and charts GoiLoan Strong monthly Stock price targets for GoiLoan 718GS2033_GS are 103.58 and 106.43 | Monthly Target 1 | 101.53 | | Monthly Target 2 | 102.77 | | Monthly Target 3 | 104.38333333333 | | Monthly Target 4 | 105.62 | | Monthly Target 5 | 107.23 |
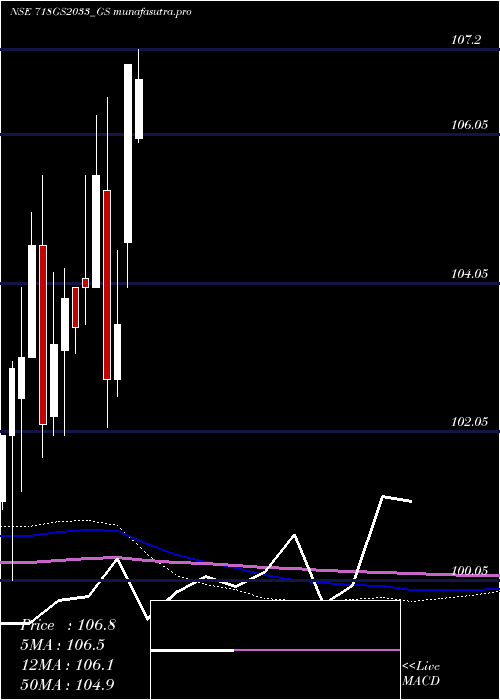
Monthly price and volumes Goi Loan
| Date |
Closing |
Open |
Range |
Volume |
Tue 28 October 2025 |
104.00 (0%) |
103.15 |
103.15 - 106.00 |
0.182 times |
Thu 25 September 2025 |
104.00 (1.32%) |
103.54 |
103.00 - 105.75 |
0.1874 times |
Fri 29 August 2025 |
102.65 (-4.33%) |
107.51 |
102.00 - 108.55 |
0.1679 times |
Thu 31 July 2025 |
107.30 (0.75%) |
107.00 |
106.75 - 108.66 |
2.7623 times |
Mon 30 June 2025 |
106.50 (-1.44%) |
107.10 |
106.00 - 108.30 |
0.292 times |
Mon 26 May 2025 |
108.06 (0.99%) |
106.00 |
105.95 - 108.06 |
1.4631 times |
Thu 24 April 2025 |
107.00 (3.38%) |
104.60 |
104.00 - 107.00 |
0.6935 times |
Fri 28 March 2025 |
103.50 (0.73%) |
102.75 |
102.53 - 104.49 |
0.1767 times |
Fri 28 February 2025 |
102.75 (-2.61%) |
105.30 |
102.11 - 106.55 |
1.2535 times |
Fri 31 January 2025 |
105.50 (1.44%) |
104.00 |
104.00 - 106.31 |
2.8215 times |
Tue 17 December 2024 |
104.00 (0.53%) |
104.11 |
103.50 - 105.50 |
0.2944 times |
DMA SMA EMA moving averages of Goi Loan 718GS2033_GS
DMA (daily moving average) of Goi Loan 718GS2033_GS
| DMA period | DMA value | | 5 day DMA | 104.64 | | 12 day DMA | 104.42 | | 20 day DMA | 104.33 | | 35 day DMA | 104.62 | | 50 day DMA | 105.51 | | 100 day DMA | 105.61 | | 150 day DMA | 105.16 | | 200 day DMA | 104.62 | EMA (exponential moving average) of Goi Loan 718GS2033_GS
| EMA period | EMA current | EMA prev | EMA prev2 | | 5 day EMA | 104.36 | 104.54 | 104.68 | | 12 day EMA | 104.41 | 104.48 | 104.52 | | 20 day EMA | 104.46 | 104.51 | 104.54 | | 35 day EMA | 105.02 | 105.08 | 105.13 | | 50 day EMA | 105.54 | 105.6 | 105.66 |
SMA (simple moving average) of Goi Loan 718GS2033_GS
| SMA period | SMA current | SMA prev | SMA prev2 | | 5 day SMA | 104.64 | 104.74 | 104.75 | | 12 day SMA | 104.42 | 104.38 | 104.36 | | 20 day SMA | 104.33 | 104.33 | 104.3 | | 35 day SMA | 104.62 | 104.73 | 104.82 | | 50 day SMA | 105.51 | 105.56 | 105.63 | | 100 day SMA | 105.61 | 105.6 | 105.58 | | 150 day SMA | 105.16 | 105.15 | 105.14 | | 200 day SMA | 104.62 | 104.61 | 104.6 |
|
|
