GoiLoan 716GS2050_GS full analysis,charts,indicators,moving averages,SMA,DMA,EMA,ADX,MACD,RSIGoi Loan 716GS2050_GS WideScreen charts, DMA,SMA,EMA technical analysis, forecast prediction, by indicators ADX,MACD,RSI,CCI NSE stock exchange
Daily price and charts and targets GoiLoan Strong Daily Stock price targets for GoiLoan 716GS2050_GS are 100.57 and 100.86 | Daily Target 1 | 100.52 | | Daily Target 2 | 100.61 | | Daily Target 3 | 100.80666666667 | | Daily Target 4 | 100.9 | | Daily Target 5 | 101.1 |
Daily price and volume Goi Loan
| Date |
Closing |
Open |
Range |
Volume |
Tue 28 October 2025 |
100.71 (-0.29%) |
101.00 |
100.71 - 101.00 |
1.2987 times |
Mon 27 October 2025 |
101.00 (0%) |
101.01 |
101.00 - 101.01 |
0.7148 times |
Fri 24 October 2025 |
101.00 (0%) |
101.00 |
100.10 - 102.00 |
0.7862 times |
Thu 23 October 2025 |
101.00 (-0.01%) |
101.03 |
101.00 - 101.03 |
1.0732 times |
Tue 21 October 2025 |
101.01 (0%) |
101.01 |
101.01 - 101.01 |
0.3574 times |
Mon 20 October 2025 |
101.01 (0.11%) |
100.10 |
100.10 - 101.25 |
1.2137 times |
Fri 17 October 2025 |
100.90 (-0.1%) |
101.60 |
100.90 - 101.60 |
0.9839 times |
Thu 16 October 2025 |
101.00 (-0.01%) |
101.00 |
101.00 - 101.00 |
0.3574 times |
Tue 14 October 2025 |
101.01 (0%) |
101.01 |
101.00 - 101.01 |
1.6794 times |
Mon 13 October 2025 |
101.01 (0.01%) |
101.01 |
101.01 - 101.45 |
1.5353 times |
Fri 10 October 2025 |
101.00 (-0.03%) |
101.00 |
101.00 - 101.01 |
1.9638 times |

Weekly price and charts GoiLoan Strong weekly Stock price targets for GoiLoan 716GS2050_GS are 100.56 and 100.86 | Weekly Target 1 | 100.51 | | Weekly Target 2 | 100.61 | | Weekly Target 3 | 100.81 | | Weekly Target 4 | 100.91 | | Weekly Target 5 | 101.11 |
Weekly price and volumes for Goi Loan
| Date |
Closing |
Open |
Range |
Volume |
Tue 28 October 2025 |
100.71 (-0.29%) |
101.01 |
100.71 - 101.01 |
0.4972 times |
Fri 24 October 2025 |
101.00 (0.1%) |
100.10 |
100.10 - 102.00 |
0.8471 times |
Fri 17 October 2025 |
100.90 (-0.1%) |
101.01 |
100.90 - 101.60 |
1.125 times |
Fri 10 October 2025 |
101.00 (0.49%) |
99.50 |
99.50 - 104.70 |
1.6869 times |
Tue 30 September 2025 |
100.51 (0%) |
100.51 |
100.51 - 100.51 |
0.0002 times |
Fri 26 September 2025 |
100.51 (-2.89%) |
101.00 |
100.51 - 101.50 |
3.4655 times |
Wed 17 September 2025 |
103.50 (-0.48%) |
104.00 |
103.50 - 109.00 |
0.0089 times |
Fri 12 September 2025 |
104.00 (3.9%) |
101.10 |
101.10 - 104.40 |
1.0618 times |
Fri 05 September 2025 |
100.10 (-1.87%) |
100.00 |
100.00 - 104.60 |
1.1029 times |
Fri 29 August 2025 |
102.01 (-1.68%) |
103.01 |
102.01 - 103.01 |
0.2045 times |
Fri 22 August 2025 |
103.75 (1.47%) |
102.75 |
102.75 - 104.40 |
0.0004 times |
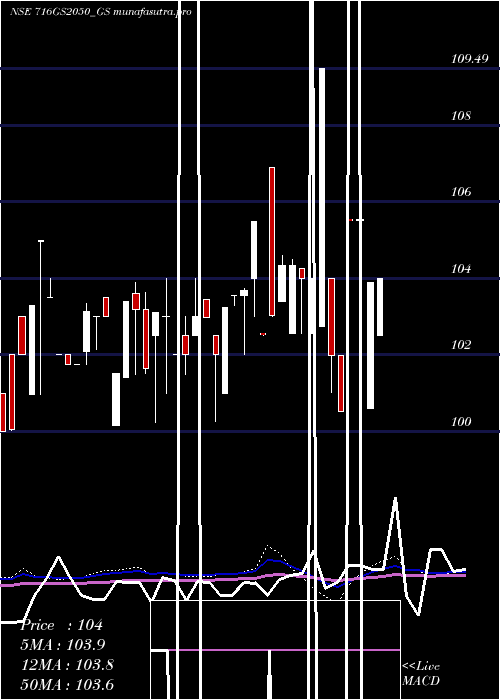
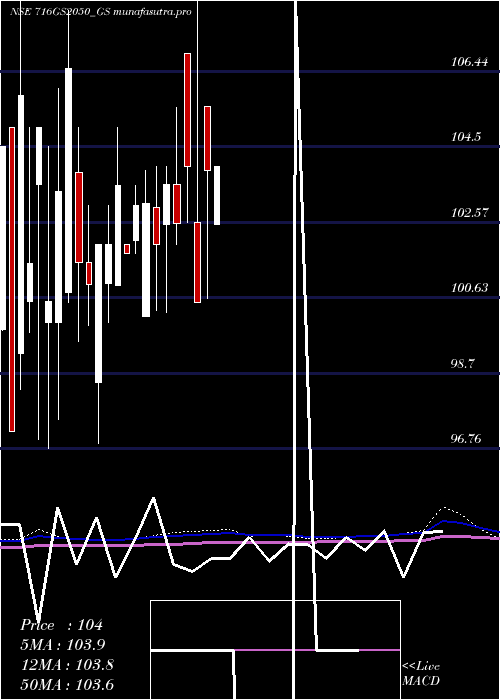
Monthly price and charts GoiLoan Strong monthly Stock price targets for GoiLoan 716GS2050_GS are 100.11 and 105.31 | Monthly Target 1 | 96.44 | | Monthly Target 2 | 98.57 | | Monthly Target 3 | 101.63666666667 | | Monthly Target 4 | 103.77 | | Monthly Target 5 | 106.84 |
Monthly price and volumes Goi Loan
| Date |
Closing |
Open |
Range |
Volume |
Tue 28 October 2025 |
100.71 (0.2%) |
99.50 |
99.50 - 104.70 |
1.3724 times |
Tue 30 September 2025 |
100.51 (-1.47%) |
100.00 |
100.00 - 109.00 |
1.8621 times |
Fri 29 August 2025 |
102.01 (-1.91%) |
105.00 |
102.01 - 105.25 |
0.2526 times |
Thu 31 July 2025 |
104.00 (3.23%) |
105.75 |
101.61 - 105.75 |
0.9554 times |
Mon 23 June 2025 |
100.75 (-8.4%) |
104.65 |
100.75 - 109.00 |
0.6292 times |
Thu 29 May 2025 |
109.99 (5.86%) |
102.51 |
102.51 - 109.99 |
0.0078 times |
Tue 29 April 2025 |
103.90 (3.37%) |
105.53 |
100.60 - 105.53 |
0.6744 times |
Fri 28 March 2025 |
100.51 (-3.36%) |
102.57 |
100.51 - 109.49 |
0.924 times |
Fri 28 February 2025 |
104.00 (1.42%) |
106.90 |
102.57 - 106.90 |
1.1049 times |
Thu 30 January 2025 |
102.54 (-0.98%) |
103.55 |
102.00 - 105.50 |
2.2173 times |
Tue 31 December 2024 |
103.55 (1.52%) |
102.50 |
100.25 - 103.99 |
0.9207 times |
DMA SMA EMA moving averages of Goi Loan 716GS2050_GS
DMA (daily moving average) of Goi Loan 716GS2050_GS
| DMA period | DMA value | | 5 day DMA | 100.94 | | 12 day DMA | 100.97 | | 20 day DMA | 101.01 | | 35 day DMA | 102.01 | | 50 day DMA | 102.62 | | 100 day DMA | 103.38 | | 150 day DMA | 103.17 | | 200 day DMA | 102.87 | EMA (exponential moving average) of Goi Loan 716GS2050_GS
| EMA period | EMA current | EMA prev | EMA prev2 | | 5 day EMA | 100.9 | 100.99 | 100.99 | | 12 day EMA | 101.03 | 101.09 | 101.11 | | 20 day EMA | 101.32 | 101.38 | 101.42 | | 35 day EMA | 101.92 | 101.99 | 102.05 | | 50 day EMA | 102.67 | 102.75 | 102.82 |
SMA (simple moving average) of Goi Loan 716GS2050_GS
| SMA period | SMA current | SMA prev | SMA prev2 | | 5 day SMA | 100.94 | 101 | 100.98 | | 12 day SMA | 100.97 | 101 | 100.96 | | 20 day SMA | 101.01 | 101.18 | 101.33 | | 35 day SMA | 102.01 | 102.11 | 102.2 | | 50 day SMA | 102.62 | 102.67 | 102.77 | | 100 day SMA | 103.38 | 103.41 | 103.43 | | 150 day SMA | 103.17 | 103.18 | 103.19 | | 200 day SMA | 102.87 | 102.9 | 102.92 |
|
|
