GoiLoan 710GS2029_GS full analysis,charts,indicators,moving averages,SMA,DMA,EMA,ADX,MACD,RSIGoi Loan 710GS2029_GS WideScreen charts, DMA,SMA,EMA technical analysis, forecast prediction, by indicators ADX,MACD,RSI,CCI NSE stock exchange
Daily price and charts and targets GoiLoan Strong Daily Stock price targets for GoiLoan 710GS2029_GS are 103.02 and 103.52 | Daily Target 1 | 102.86 | | Daily Target 2 | 103.18 | | Daily Target 3 | 103.36333333333 | | Daily Target 4 | 103.68 | | Daily Target 5 | 103.86 |
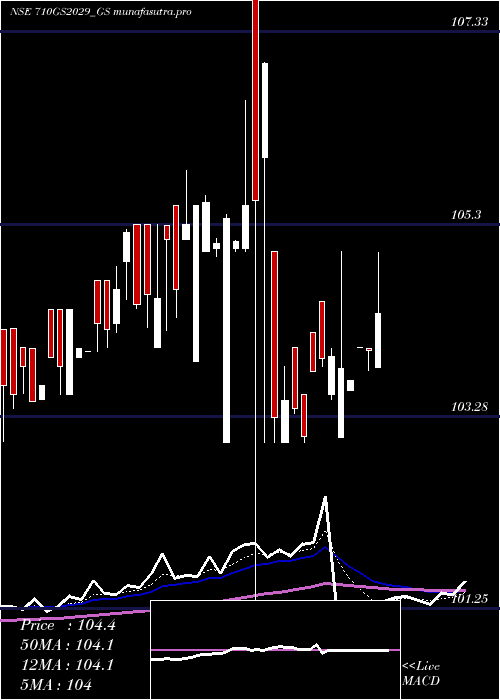
Daily price and volume Goi Loan
| Date |
Closing |
Open |
Range |
Volume |
Wed 29 October 2025 |
103.49 (0.33%) |
103.55 |
103.05 - 103.55 |
7.3841 times |
Tue 28 October 2025 |
103.15 (0.15%) |
103.20 |
103.00 - 103.20 |
1.1808 times |
Mon 27 October 2025 |
103.00 (-0.15%) |
103.15 |
103.00 - 103.15 |
0.1349 times |
Fri 24 October 2025 |
103.15 (0.1%) |
103.06 |
103.06 - 103.40 |
0.1356 times |
Thu 23 October 2025 |
103.05 (-0.43%) |
103.00 |
102.90 - 103.30 |
0.7324 times |
Mon 20 October 2025 |
103.49 (0.76%) |
102.25 |
102.25 - 103.55 |
0.4143 times |
Fri 17 October 2025 |
102.71 (-1.26%) |
102.71 |
102.71 - 102.71 |
0.0025 times |
Thu 16 October 2025 |
104.02 (-1.87%) |
104.02 |
104.02 - 104.02 |
0.0076 times |
Wed 15 October 2025 |
106.00 (-0.28%) |
106.00 |
106.00 - 106.00 |
0.0025 times |
Tue 14 October 2025 |
106.30 (-0.56%) |
106.00 |
106.00 - 106.30 |
0.0052 times |
Mon 13 October 2025 |
106.90 (0.84%) |
106.10 |
106.10 - 106.90 |
0.0025 times |
Weekly price and charts GoiLoan Strong weekly Stock price targets for GoiLoan 710GS2029_GS are 103.25 and 103.8 | Weekly Target 1 | 102.8 | | Weekly Target 2 | 103.14 | | Weekly Target 3 | 103.34666666667 | | Weekly Target 4 | 103.69 | | Weekly Target 5 | 103.9 |
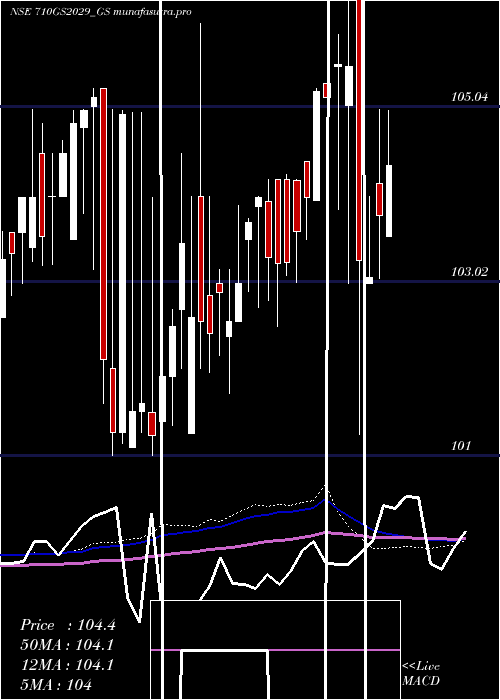
Weekly price and volumes for Goi Loan
| Date |
Closing |
Open |
Range |
Volume |
Wed 29 October 2025 |
103.49 (0.33%) |
103.15 |
103.00 - 103.55 |
4.3903 times |
Fri 24 October 2025 |
103.15 (0.43%) |
102.25 |
102.25 - 103.55 |
0.6471 times |
Fri 17 October 2025 |
102.71 (-3.11%) |
106.10 |
102.71 - 106.90 |
0.0103 times |
Fri 10 October 2025 |
106.01 (-0.01%) |
105.85 |
105.85 - 106.40 |
0.039 times |
Fri 03 October 2025 |
106.02 (0.02%) |
105.75 |
105.54 - 106.02 |
0.4262 times |
Fri 26 September 2025 |
106.00 (0.79%) |
105.02 |
105.02 - 106.40 |
2.9433 times |
Fri 19 September 2025 |
105.17 (0.16%) |
105.63 |
104.61 - 105.64 |
0.5645 times |
Fri 12 September 2025 |
105.00 (-0.6%) |
105.64 |
104.50 - 105.64 |
0.1544 times |
Fri 05 September 2025 |
105.63 (0.95%) |
104.64 |
103.55 - 105.85 |
0.5961 times |
Fri 29 August 2025 |
104.64 (0.33%) |
104.45 |
100.00 - 104.68 |
0.2287 times |
Fri 22 August 2025 |
104.30 (-1.04%) |
105.50 |
104.01 - 105.50 |
13.0239 times |
Monthly price and charts GoiLoan Strong monthly Stock price targets for GoiLoan 710GS2029_GS are 100.55 and 105.2 | Monthly Target 1 | 99.56 | | Monthly Target 2 | 101.53 | | Monthly Target 3 | 104.21333333333 | | Monthly Target 4 | 106.18 | | Monthly Target 5 | 108.86 |
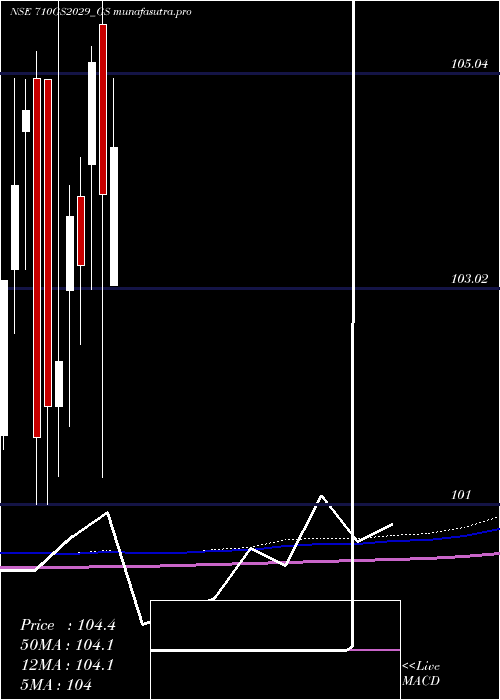
Monthly price and volumes Goi Loan
| Date |
Closing |
Open |
Range |
Volume |
Wed 29 October 2025 |
103.49 (-2.37%) |
106.00 |
102.25 - 106.90 |
0.8405 times |
Tue 30 September 2025 |
106.00 (1.3%) |
104.64 |
103.55 - 106.40 |
0.7655 times |
Fri 29 August 2025 |
104.64 (-1%) |
105.30 |
100.00 - 108.54 |
2.392 times |
Thu 31 July 2025 |
105.70 (1.08%) |
104.75 |
104.75 - 105.95 |
0.5382 times |
Mon 30 June 2025 |
104.57 (-0.48%) |
105.00 |
104.05 - 105.50 |
0.6001 times |
Fri 30 May 2025 |
105.07 (1.13%) |
103.05 |
102.76 - 105.08 |
0.356 times |
Wed 30 April 2025 |
103.90 (-1.18%) |
105.50 |
101.25 - 108.15 |
1.7208 times |
Fri 28 March 2025 |
105.14 (1.84%) |
104.19 |
103.01 - 105.30 |
1.3852 times |
Fri 28 February 2025 |
103.24 (-0.44%) |
103.89 |
102.50 - 104.25 |
0.645 times |
Fri 31 January 2025 |
103.70 (1.33%) |
103.00 |
101.73 - 104.00 |
0.7567 times |
Tue 31 December 2024 |
102.34 (0.41%) |
101.92 |
101.26 - 106.00 |
0.603 times |
DMA SMA EMA moving averages of Goi Loan 710GS2029_GS
DMA (daily moving average) of Goi Loan 710GS2029_GS
| DMA period | DMA value | | 5 day DMA | 103.17 | | 12 day DMA | 104.27 | | 20 day DMA | 104.97 | | 35 day DMA | 105.08 | | 50 day DMA | 104.99 | | 100 day DMA | 105.04 | | 150 day DMA | 104.84 | | 200 day DMA | 104.41 | EMA (exponential moving average) of Goi Loan 710GS2029_GS
| EMA period | EMA current | EMA prev | EMA prev2 | | 5 day EMA | 103.38 | 103.32 | 103.4 | | 12 day EMA | 103.98 | 104.07 | 104.24 | | 20 day EMA | 104.43 | 104.53 | 104.67 | | 35 day EMA | 104.73 | 104.8 | 104.9 | | 50 day EMA | 104.84 | 104.9 | 104.97 |
SMA (simple moving average) of Goi Loan 710GS2029_GS
| SMA period | SMA current | SMA prev | SMA prev2 | | 5 day SMA | 103.17 | 103.17 | 103.08 | | 12 day SMA | 104.27 | 104.52 | 104.74 | | 20 day SMA | 104.97 | 105.09 | 105.23 | | 35 day SMA | 105.08 | 105.12 | 105.16 | | 50 day SMA | 104.99 | 105.03 | 105.07 | | 100 day SMA | 105.04 | 105.05 | 105.07 | | 150 day SMA | 104.84 | 104.84 | 104.85 | | 200 day SMA | 104.41 | 104.41 | 104.4 |
|
|
