GoiLoan 709GS2074_GS full analysis,charts,indicators,moving averages,SMA,DMA,EMA,ADX,MACD,RSIGoi Loan 709GS2074_GS WideScreen charts, DMA,SMA,EMA technical analysis, forecast prediction, by indicators ADX,MACD,RSI,CCI NSE stock exchange
Daily price and charts and targets GoiLoan Strong Daily Stock price targets for GoiLoan 709GS2074_GS are 101.4 and 102.6 | Daily Target 1 | 100.73 | | Daily Target 2 | 101.37 | | Daily Target 3 | 101.93333333333 | | Daily Target 4 | 102.57 | | Daily Target 5 | 103.13 |
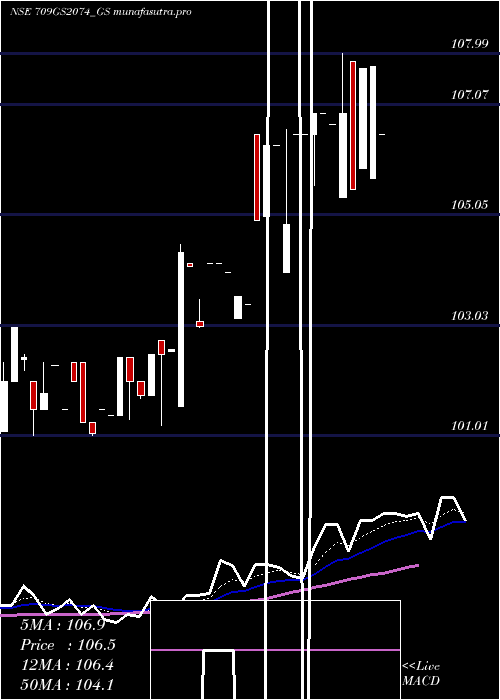
Daily price and volume Goi Loan
| Date |
Closing |
Open |
Range |
Volume |
Tue 28 October 2025 |
102.00 (0.26%) |
102.00 |
101.30 - 102.50 |
1.8563 times |
Mon 27 October 2025 |
101.74 (-0.07%) |
101.81 |
101.70 - 102.00 |
0.1127 times |
Fri 24 October 2025 |
101.81 (-0.02%) |
101.71 |
101.70 - 102.84 |
0.0233 times |
Thu 23 October 2025 |
101.83 (-0.52%) |
103.10 |
101.81 - 103.10 |
0.1417 times |
Tue 21 October 2025 |
102.36 (0.6%) |
101.75 |
101.75 - 102.90 |
0.0515 times |
Mon 20 October 2025 |
101.75 (0%) |
101.75 |
101.75 - 103.00 |
0.0791 times |
Fri 17 October 2025 |
101.75 (0.13%) |
101.05 |
101.05 - 101.80 |
6.011 times |
Thu 16 October 2025 |
101.62 (0.02%) |
101.80 |
101.50 - 101.80 |
0.3171 times |
Wed 15 October 2025 |
101.60 (0.04%) |
100.54 |
100.54 - 101.85 |
1.3197 times |
Tue 14 October 2025 |
101.56 (0.02%) |
101.80 |
101.10 - 101.80 |
0.0876 times |
Mon 13 October 2025 |
101.54 (0.3%) |
100.10 |
100.05 - 101.65 |
0.1198 times |
Weekly price and charts GoiLoan Strong weekly Stock price targets for GoiLoan 709GS2074_GS are 101.65 and 102.85 | Weekly Target 1 | 100.73 | | Weekly Target 2 | 101.37 | | Weekly Target 3 | 101.93333333333 | | Weekly Target 4 | 102.57 | | Weekly Target 5 | 103.13 |
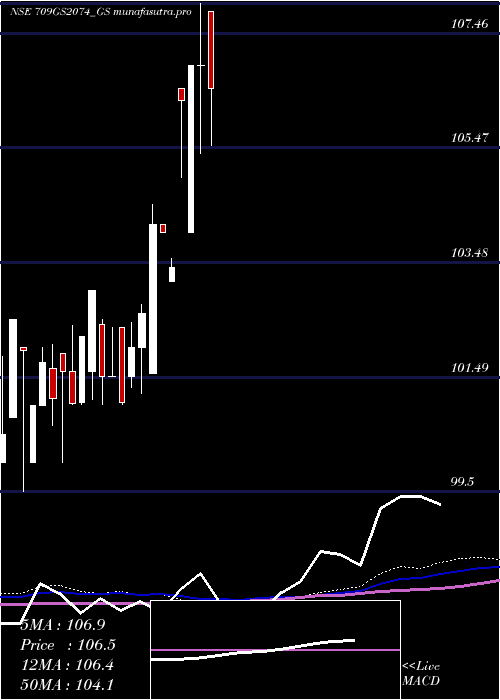
Weekly price and volumes for Goi Loan
| Date |
Closing |
Open |
Range |
Volume |
Tue 28 October 2025 |
102.00 (0.19%) |
101.81 |
101.30 - 102.50 |
0.2594 times |
Fri 24 October 2025 |
101.81 (0.06%) |
101.75 |
101.70 - 103.10 |
0.039 times |
Fri 17 October 2025 |
101.75 (0.5%) |
100.10 |
100.05 - 101.85 |
1.0348 times |
Fri 10 October 2025 |
101.24 (0.26%) |
100.80 |
100.05 - 101.29 |
0.1751 times |
Fri 03 October 2025 |
100.98 (0.98%) |
100.50 |
99.12 - 101.00 |
0.0393 times |
Fri 26 September 2025 |
100.00 (-0.66%) |
102.00 |
99.50 - 102.00 |
1.1983 times |
Fri 19 September 2025 |
100.66 (-0.51%) |
101.18 |
100.01 - 101.50 |
5.1278 times |
Fri 12 September 2025 |
101.18 (0.68%) |
100.50 |
100.00 - 101.99 |
1.3062 times |
Fri 05 September 2025 |
100.50 (1.12%) |
99.70 |
98.20 - 100.70 |
0.5898 times |
Fri 29 August 2025 |
99.39 (0.39%) |
99.50 |
98.00 - 100.00 |
0.2303 times |
Fri 22 August 2025 |
99.00 (-0.78%) |
99.85 |
98.90 - 99.90 |
0.4027 times |
Monthly price and charts GoiLoan Strong monthly Stock price targets for GoiLoan 709GS2074_GS are 100.56 and 104.54 | Monthly Target 1 | 97.43 | | Monthly Target 2 | 99.71 | | Monthly Target 3 | 101.40666666667 | | Monthly Target 4 | 103.69 | | Monthly Target 5 | 105.39 |
Monthly price and volumes Goi Loan
| Date |
Closing |
Open |
Range |
Volume |
Tue 28 October 2025 |
102.00 (1.88%) |
99.95 |
99.12 - 103.10 |
1.2131 times |
Tue 30 September 2025 |
100.12 (0.73%) |
99.70 |
98.20 - 102.00 |
6.4817 times |
Fri 29 August 2025 |
99.39 (-1.79%) |
101.50 |
98.00 - 102.00 |
0.9926 times |
Thu 31 July 2025 |
101.20 (0.61%) |
100.60 |
100.06 - 105.69 |
0.478 times |
Mon 30 June 2025 |
100.59 (-3.73%) |
104.55 |
99.90 - 104.55 |
0.5283 times |
Fri 30 May 2025 |
104.49 (-2.07%) |
105.37 |
102.50 - 108.15 |
0.2114 times |
Wed 30 April 2025 |
106.70 (2.45%) |
104.15 |
103.15 - 106.90 |
0.007 times |
Fri 28 March 2025 |
104.15 (3.07%) |
101.50 |
101.20 - 104.50 |
0.0307 times |
Fri 28 February 2025 |
101.05 (-1.13%) |
101.60 |
101.01 - 103.00 |
0.0352 times |
Fri 31 January 2025 |
102.20 (1.19%) |
101.50 |
100.01 - 102.38 |
0.0219 times |
Tue 31 December 2024 |
101.00 (0%) |
100.00 |
99.50 - 102.49 |
0.05 times |

DMA SMA EMA moving averages of Goi Loan 709GS2074_GS
DMA (daily moving average) of Goi Loan 709GS2074_GS
| DMA period | DMA value | | 5 day DMA | 101.95 | | 12 day DMA | 101.73 | | 20 day DMA | 101.33 | | 35 day DMA | 101.09 | | 50 day DMA | 100.55 | | 100 day DMA | 100.91 | | 150 day DMA | 102.28 | | 200 day DMA | 102.09 | EMA (exponential moving average) of Goi Loan 709GS2074_GS
| EMA period | EMA current | EMA prev | EMA prev2 | | 5 day EMA | 101.87 | 101.81 | 101.84 | | 12 day EMA | 101.68 | 101.62 | 101.6 | | 20 day EMA | 101.44 | 101.38 | 101.34 | | 35 day EMA | 101.04 | 100.98 | 100.94 | | 50 day EMA | 100.67 | 100.62 | 100.57 |
SMA (simple moving average) of Goi Loan 709GS2074_GS
| SMA period | SMA current | SMA prev | SMA prev2 | | 5 day SMA | 101.95 | 101.9 | 101.9 | | 12 day SMA | 101.73 | 101.65 | 101.58 | | 20 day SMA | 101.33 | 101.23 | 101.16 | | 35 day SMA | 101.09 | 101.05 | 101 | | 50 day SMA | 100.55 | 100.51 | 100.47 | | 100 day SMA | 100.91 | 100.93 | 100.96 | | 150 day SMA | 102.28 | 102.28 | 102.27 | | 200 day SMA | 102.09 | 102.09 |
|
|
