GoiLoan 706GS2028_GS full analysis,charts,indicators,moving averages,SMA,DMA,EMA,ADX,MACD,RSIGoi Loan 706GS2028_GS WideScreen charts, DMA,SMA,EMA technical analysis, forecast prediction, by indicators ADX,MACD,RSI,CCI NSE stock exchange
Daily price and charts and targets GoiLoan Strong Daily Stock price targets for GoiLoan 706GS2028_GS are 103 and 103 | Daily Target 1 | 103 | | Daily Target 2 | 103 | | Daily Target 3 | 103 | | Daily Target 4 | 103 | | Daily Target 5 | 103 |
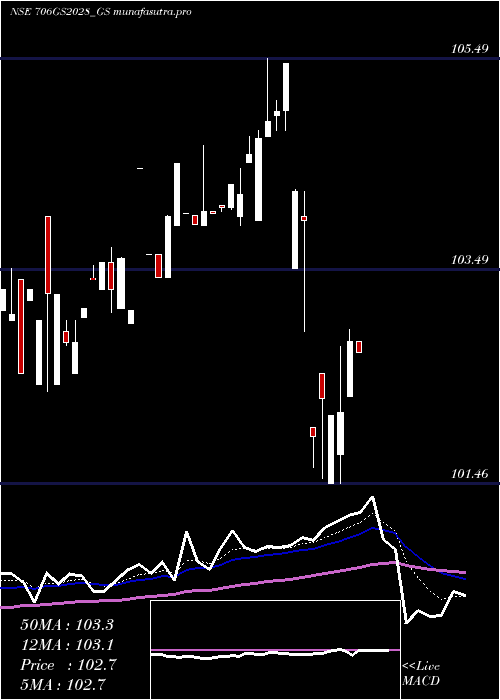
Daily price and volume Goi Loan
| Date |
Closing |
Open |
Range |
Volume |
Tue 28 October 2025 |
103.00 (-0.17%) |
103.00 |
103.00 - 103.00 |
0.5438 times |
Mon 27 October 2025 |
103.18 (-0.07%) |
103.10 |
103.10 - 103.19 |
1.4682 times |
Fri 24 October 2025 |
103.25 (0.05%) |
103.25 |
103.25 - 103.25 |
0.4992 times |
Thu 23 October 2025 |
103.20 (0.58%) |
103.00 |
102.25 - 103.25 |
0.1365 times |
Tue 21 October 2025 |
102.60 (-0.63%) |
102.95 |
102.51 - 102.95 |
3.2626 times |
Mon 20 October 2025 |
103.25 (1.07%) |
102.70 |
102.70 - 103.25 |
2.3518 times |
Fri 17 October 2025 |
102.16 (-0.42%) |
102.25 |
102.16 - 102.25 |
0.0544 times |
Thu 16 October 2025 |
102.59 (-0.4%) |
102.90 |
102.55 - 102.90 |
0.4872 times |
Wed 15 October 2025 |
103.00 (0.83%) |
102.20 |
102.20 - 103.00 |
0.6525 times |
Tue 14 October 2025 |
102.15 (0.1%) |
102.15 |
102.15 - 102.15 |
0.5438 times |
Fri 10 October 2025 |
102.05 (-0.92%) |
102.00 |
102.00 - 102.30 |
3.5617 times |
Weekly price and charts GoiLoan Strong weekly Stock price targets for GoiLoan 706GS2028_GS are 102.91 and 103.1 | Weekly Target 1 | 102.87 | | Weekly Target 2 | 102.94 | | Weekly Target 3 | 103.06333333333 | | Weekly Target 4 | 103.13 | | Weekly Target 5 | 103.25 |
Weekly price and volumes for Goi Loan
| Date |
Closing |
Open |
Range |
Volume |
Tue 28 October 2025 |
103.00 (-0.24%) |
103.10 |
103.00 - 103.19 |
0.1408 times |
Fri 24 October 2025 |
103.25 (1.07%) |
102.70 |
102.25 - 103.25 |
0.4374 times |
Fri 17 October 2025 |
102.16 (0.11%) |
102.15 |
102.15 - 103.00 |
0.1216 times |
Fri 10 October 2025 |
102.05 (-3.09%) |
105.30 |
102.00 - 106.10 |
0.8889 times |
Fri 03 October 2025 |
105.30 (0.43%) |
105.00 |
104.75 - 105.30 |
2.6201 times |
Fri 26 September 2025 |
104.85 (-0.62%) |
104.80 |
104.80 - 105.99 |
0.2283 times |
Wed 17 September 2025 |
105.50 (0.96%) |
104.50 |
104.50 - 106.00 |
1.6249 times |
Fri 12 September 2025 |
104.50 (0.29%) |
104.35 |
104.35 - 105.60 |
1.2626 times |
Thu 04 September 2025 |
104.20 (-0.09%) |
104.20 |
104.08 - 105.30 |
1.8472 times |
Fri 29 August 2025 |
104.29 (-0.68%) |
105.00 |
102.00 - 105.00 |
0.828 times |
Thu 21 August 2025 |
105.00 (1.3%) |
103.70 |
103.70 - 105.00 |
0.5328 times |

Monthly price and charts GoiLoan Strong monthly Stock price targets for GoiLoan 706GS2028_GS are 100.45 and 104.55 | Monthly Target 1 | 99.6 | | Monthly Target 2 | 101.3 | | Monthly Target 3 | 103.7 | | Monthly Target 4 | 105.4 | | Monthly Target 5 | 107.8 |
Monthly price and volumes Goi Loan
| Date |
Closing |
Open |
Range |
Volume |
Tue 28 October 2025 |
103.00 (-1.9%) |
104.75 |
102.00 - 106.10 |
0.1119 times |
Tue 30 September 2025 |
105.00 (0.68%) |
104.20 |
104.08 - 106.00 |
0.4301 times |
Fri 29 August 2025 |
104.29 (-0.3%) |
104.60 |
102.00 - 105.10 |
0.1619 times |
Thu 31 July 2025 |
104.60 (1.04%) |
103.69 |
103.69 - 104.99 |
0.4093 times |
Mon 30 June 2025 |
103.52 (-0.27%) |
104.00 |
103.40 - 104.70 |
0.3837 times |
Thu 29 May 2025 |
103.80 (1.22%) |
103.00 |
102.50 - 104.25 |
1.7721 times |
Wed 30 April 2025 |
102.55 (-1.94%) |
103.95 |
101.46 - 105.49 |
0.7532 times |
Fri 28 March 2025 |
104.58 (1.24%) |
103.11 |
102.98 - 104.75 |
5.0139 times |
Fri 28 February 2025 |
103.30 (0.29%) |
103.10 |
102.33 - 104.00 |
0.4501 times |
Fri 31 January 2025 |
103.00 (-0.01%) |
102.00 |
101.60 - 103.50 |
0.5139 times |
Mon 30 December 2024 |
103.01 (1.55%) |
101.50 |
101.43 - 103.50 |
0.2842 times |

DMA SMA EMA moving averages of Goi Loan 706GS2028_GS
DMA (daily moving average) of Goi Loan 706GS2028_GS
| DMA period | DMA value | | 5 day DMA | 103.05 | | 12 day DMA | 102.79 | | 20 day DMA | 103.8 | | 35 day DMA | 104.19 | | 50 day DMA | 104.2 | | 100 day DMA | 104.05 | | 150 day DMA | 103.84 | | 200 day DMA | 103.36 | EMA (exponential moving average) of Goi Loan 706GS2028_GS
| EMA period | EMA current | EMA prev | EMA prev2 | | 5 day EMA | 103.06 | 103.09 | 103.04 | | 12 day EMA | 103.25 | 103.29 | 103.31 | | 20 day EMA | 103.55 | 103.61 | 103.65 | | 35 day EMA | 103.83 | 103.88 | 103.92 | | 50 day EMA | 104.11 | 104.16 | 104.2 |
SMA (simple moving average) of Goi Loan 706GS2028_GS
| SMA period | SMA current | SMA prev | SMA prev2 | | 5 day SMA | 103.05 | 103.1 | 102.89 | | 12 day SMA | 102.79 | 103.04 | 103.25 | | 20 day SMA | 103.8 | 103.91 | 103.99 | | 35 day SMA | 104.19 | 104.19 | 104.24 | | 50 day SMA | 104.2 | 104.23 | 104.25 | | 100 day SMA | 104.05 | 104.05 | 104.05 | | 150 day SMA | 103.84 | 103.84 | 103.84 | | 200 day SMA | 103.36 | 103.35 | 103.34 |
|
|
