GoiLoan 704GS2029_GS full analysis,charts,indicators,moving averages,SMA,DMA,EMA,ADX,MACD,RSIGoi Loan 704GS2029_GS WideScreen charts, DMA,SMA,EMA technical analysis, forecast prediction, by indicators ADX,MACD,RSI,CCI NSE stock exchange
Daily price and charts and targets GoiLoan Strong Daily Stock price targets for GoiLoan 704GS2029_GS are 104.5 and 104.5 | Daily Target 1 | 104.5 | | Daily Target 2 | 104.5 | | Daily Target 3 | 104.5 | | Daily Target 4 | 104.5 | | Daily Target 5 | 104.5 |
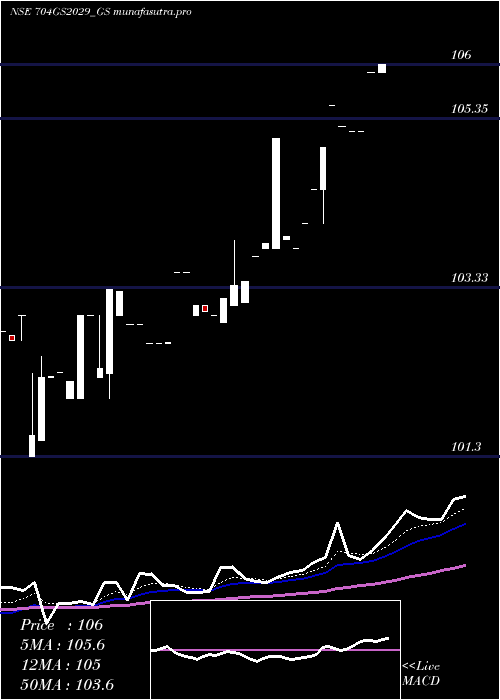
Daily price and volume Goi Loan
| Date |
Closing |
Open |
Range |
Volume |
Tue 28 October 2025 |
104.50 (-0.67%) |
104.50 |
104.50 - 104.50 |
4.3369 times |
Mon 27 October 2025 |
105.20 (0.19%) |
105.00 |
105.00 - 105.20 |
0.5204 times |
Fri 24 October 2025 |
105.00 (0.24%) |
105.00 |
105.00 - 105.00 |
0.0434 times |
Thu 23 October 2025 |
104.75 (0%) |
104.75 |
104.75 - 104.75 |
0.4814 times |
Mon 20 October 2025 |
104.75 (0%) |
104.75 |
104.75 - 104.75 |
0.4771 times |
Thu 16 October 2025 |
104.75 (0.14%) |
104.75 |
104.75 - 104.75 |
0.6072 times |
Wed 15 October 2025 |
104.60 (0.1%) |
104.50 |
104.00 - 104.60 |
0.7806 times |
Tue 14 October 2025 |
104.50 (0.97%) |
104.00 |
104.00 - 104.70 |
0.4771 times |
Mon 13 October 2025 |
103.50 (-0.86%) |
104.00 |
103.50 - 104.00 |
0.0642 times |
Thu 09 October 2025 |
104.40 (-0.1%) |
104.50 |
104.00 - 104.50 |
2.2118 times |
Wed 08 October 2025 |
104.50 (0.48%) |
104.50 |
104.50 - 104.50 |
2.1043 times |
Weekly price and charts GoiLoan Strong weekly Stock price targets for GoiLoan 704GS2029_GS are 104.15 and 104.85 | Weekly Target 1 | 104.03 | | Weekly Target 2 | 104.27 | | Weekly Target 3 | 104.73333333333 | | Weekly Target 4 | 104.97 | | Weekly Target 5 | 105.43 |
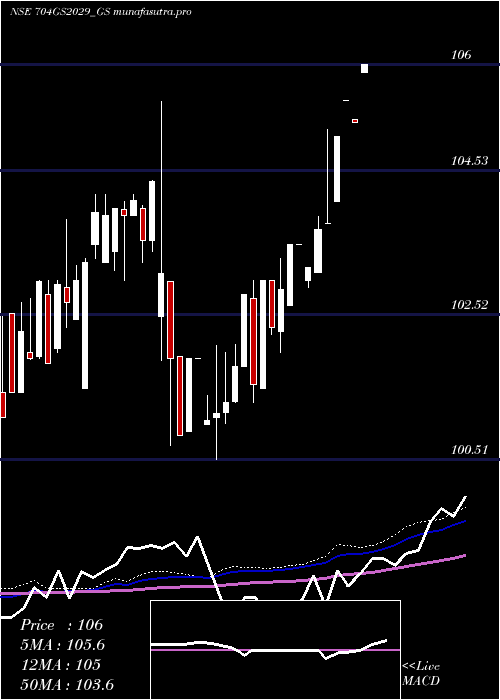
Weekly price and volumes for Goi Loan
| Date |
Closing |
Open |
Range |
Volume |
Tue 28 October 2025 |
104.50 (-0.48%) |
105.00 |
104.50 - 105.20 |
0.0097 times |
Fri 24 October 2025 |
105.00 (0.24%) |
104.75 |
104.75 - 105.00 |
0.002 times |
Thu 16 October 2025 |
104.75 (0.34%) |
104.00 |
103.50 - 104.75 |
0.0038 times |
Thu 09 October 2025 |
104.40 (-0.1%) |
104.50 |
104.00 - 104.50 |
0.0088 times |
Fri 03 October 2025 |
104.50 (0.48%) |
104.00 |
104.00 - 104.50 |
0.0003 times |
Fri 26 September 2025 |
104.00 (-1.1%) |
103.50 |
103.50 - 104.00 |
0.009 times |
Thu 18 September 2025 |
105.16 (0.73%) |
103.51 |
103.50 - 105.16 |
2.1636 times |
Fri 12 September 2025 |
104.40 (0.87%) |
104.54 |
103.94 - 104.99 |
7.7913 times |
Fri 05 September 2025 |
103.50 (0%) |
103.50 |
103.50 - 103.61 |
0.0036 times |
Fri 29 August 2025 |
103.50 (0.34%) |
103.15 |
102.76 - 103.50 |
0.0079 times |
Fri 22 August 2025 |
103.15 (0.15%) |
104.60 |
102.90 - 104.60 |
0.0029 times |
Monthly price and charts GoiLoan Strong monthly Stock price targets for GoiLoan 704GS2029_GS are 104 and 105.7 | Monthly Target 1 | 102.7 | | Monthly Target 2 | 103.6 | | Monthly Target 3 | 104.4 | | Monthly Target 4 | 105.3 | | Monthly Target 5 | 106.1 |
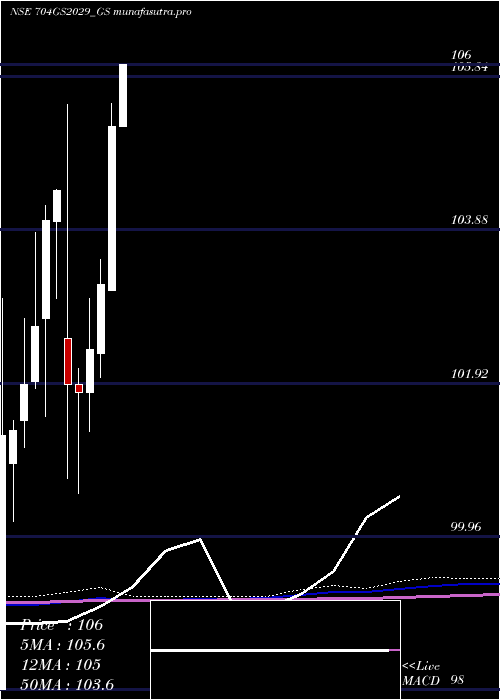
Monthly price and volumes Goi Loan
| Date |
Closing |
Open |
Range |
Volume |
Tue 28 October 2025 |
104.50 (0.48%) |
104.00 |
103.50 - 105.20 |
0.0231 times |
Tue 30 September 2025 |
104.00 (0.48%) |
103.50 |
103.50 - 105.16 |
9.3916 times |
Fri 29 August 2025 |
103.50 (-0.63%) |
103.75 |
102.76 - 104.90 |
0.0108 times |
Thu 31 July 2025 |
104.16 (1.12%) |
103.00 |
103.00 - 104.75 |
0.0235 times |
Thu 26 June 2025 |
103.01 (-1.9%) |
105.00 |
102.75 - 105.00 |
0.1694 times |
Thu 29 May 2025 |
105.00 (-0.19%) |
105.20 |
105.00 - 106.52 |
0.1456 times |
Wed 30 April 2025 |
105.20 (1.95%) |
103.11 |
103.11 - 105.50 |
0.1202 times |
Fri 28 March 2025 |
103.19 (0.82%) |
102.30 |
102.00 - 103.50 |
0.0307 times |
Fri 28 February 2025 |
102.35 (0.54%) |
101.80 |
101.30 - 103.00 |
0.0392 times |
Fri 31 January 2025 |
101.80 (-0.11%) |
101.91 |
100.51 - 102.11 |
0.046 times |
Fri 27 December 2024 |
101.91 (-2.37%) |
102.50 |
100.70 - 105.49 |
0.0719 times |
DMA SMA EMA moving averages of Goi Loan 704GS2029_GS
DMA (daily moving average) of Goi Loan 704GS2029_GS
| DMA period | DMA value | | 5 day DMA | 104.84 | | 12 day DMA | 104.54 | | 20 day DMA | 104.31 | | 35 day DMA | 104.09 | | 50 day DMA | 104.04 | | 100 day DMA | 104.31 | | 150 day DMA | 103.5 | | 200 day DMA | 103.5 | EMA (exponential moving average) of Goi Loan 704GS2029_GS
| EMA period | EMA current | EMA prev | EMA prev2 | | 5 day EMA | 104.77 | 104.9 | 104.75 | | 12 day EMA | 104.59 | 104.61 | 104.5 | | 20 day EMA | 104.44 | 104.43 | 104.35 | | 35 day EMA | 104.25 | 104.24 | 104.18 | | 50 day EMA | 104.11 | 104.09 | 104.04 |
SMA (simple moving average) of Goi Loan 704GS2029_GS
| SMA period | SMA current | SMA prev | SMA prev2 | | 5 day SMA | 104.84 | 104.89 | 104.77 | | 12 day SMA | 104.54 | 104.54 | 104.44 | | 20 day SMA | 104.31 | 104.31 | 104.29 | | 35 day SMA | 104.09 | 104.06 | 104.02 | | 50 day SMA | 104.04 | 104.03 | 103.99 | | 100 day SMA | 104.31 | 104.29 | 104.26 | | 150 day SMA | 103.5 | 103.48 | 103.46 | | 200 day SMA | 103.5 | 103.49 | 103.48 |
|
|
