GoiLoan 702GS2031_GS full analysis,charts,indicators,moving averages,SMA,DMA,EMA,ADX,MACD,RSIGoi Loan 702GS2031_GS WideScreen charts, DMA,SMA,EMA technical analysis, forecast prediction, by indicators ADX,MACD,RSI,CCI NSE stock exchange
Daily price and charts and targets GoiLoan Strong Daily Stock price targets for GoiLoan 702GS2031_GS are 104.01 and 104.01 | Daily Target 1 | 104.01 | | Daily Target 2 | 104.01 | | Daily Target 3 | 104.01 | | Daily Target 4 | 104.01 | | Daily Target 5 | 104.01 |
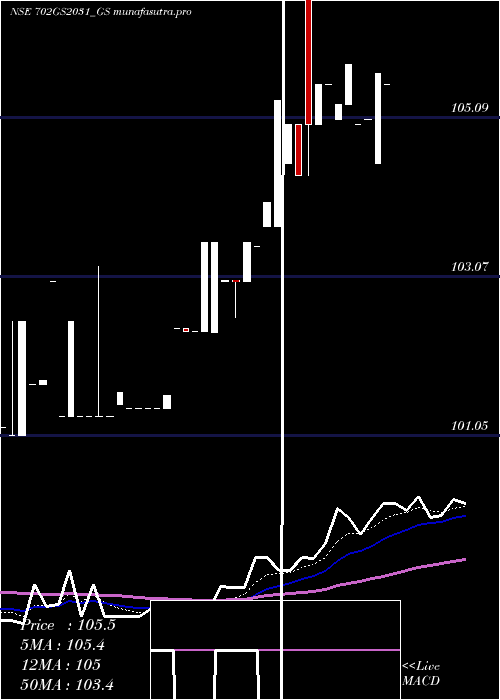
Daily price and volume Goi Loan
| Date |
Closing |
Open |
Range |
Volume |
Mon 27 October 2025 |
104.01 (0%) |
104.01 |
104.01 - 104.01 |
0.0692 times |
Fri 24 October 2025 |
104.01 (0.01%) |
104.00 |
104.00 - 104.01 |
0.7075 times |
Tue 21 October 2025 |
104.00 (0%) |
104.00 |
104.00 - 104.00 |
0.0692 times |
Mon 20 October 2025 |
104.00 (-0.95%) |
104.00 |
104.00 - 104.00 |
4.3077 times |
Thu 16 October 2025 |
105.00 (1.74%) |
103.20 |
102.00 - 105.00 |
2.1791 times |
Wed 15 October 2025 |
103.20 (0.68%) |
103.20 |
103.20 - 103.20 |
0.6916 times |
Tue 14 October 2025 |
102.50 (-0.49%) |
103.20 |
102.50 - 103.20 |
1.5214 times |
Fri 10 October 2025 |
103.00 (-0.97%) |
103.00 |
103.00 - 103.00 |
0.0692 times |
Wed 08 October 2025 |
104.01 (-0.18%) |
103.20 |
103.20 - 104.01 |
0.2538 times |
Tue 07 October 2025 |
104.20 (0.97%) |
104.20 |
104.20 - 104.20 |
0.1314 times |
Mon 06 October 2025 |
103.20 (-0.77%) |
103.20 |
103.20 - 103.20 |
0.3458 times |
Weekly price and charts GoiLoan Strong weekly Stock price targets for GoiLoan 702GS2031_GS are 104.01 and 104.01 | Weekly Target 1 | 104.01 | | Weekly Target 2 | 104.01 | | Weekly Target 3 | 104.01 | | Weekly Target 4 | 104.01 | | Weekly Target 5 | 104.01 |
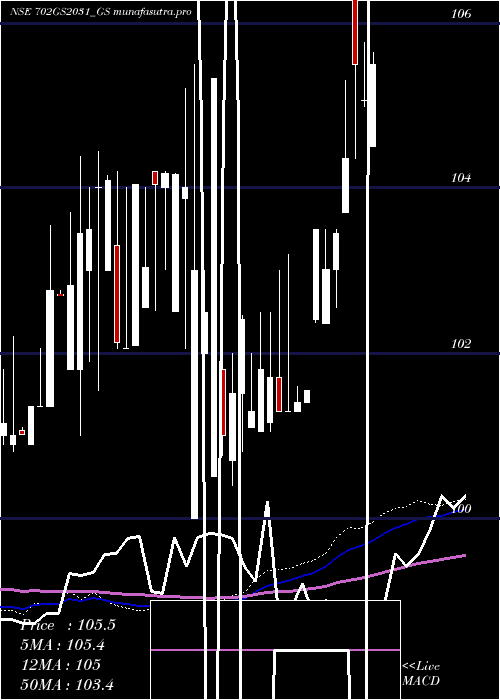
Weekly price and volumes for Goi Loan
| Date |
Closing |
Open |
Range |
Volume |
Mon 27 October 2025 |
104.01 (0%) |
104.01 |
104.01 - 104.01 |
0.02 times |
Fri 24 October 2025 |
104.01 (-0.94%) |
104.00 |
104.00 - 104.01 |
1.4728 times |
Thu 16 October 2025 |
105.00 (1.94%) |
103.20 |
102.00 - 105.00 |
1.2723 times |
Fri 10 October 2025 |
103.00 (-0.96%) |
103.20 |
103.00 - 104.20 |
0.2318 times |
Fri 03 October 2025 |
104.00 (-0.01%) |
102.97 |
102.75 - 104.00 |
2.2216 times |
Tue 23 September 2025 |
104.01 (0.25%) |
104.00 |
104.00 - 104.01 |
2.0434 times |
Fri 19 September 2025 |
103.75 (0.73%) |
103.50 |
103.00 - 103.75 |
0.8013 times |
Thu 11 September 2025 |
103.00 (-0.39%) |
104.50 |
103.00 - 104.50 |
0.1857 times |
Thu 04 September 2025 |
103.40 (0%) |
103.30 |
102.65 - 103.40 |
1.5978 times |
Fri 29 August 2025 |
103.40 (0%) |
103.30 |
102.25 - 103.40 |
0.1533 times |
Fri 22 August 2025 |
103.40 (0.23%) |
103.00 |
103.00 - 103.40 |
0.0871 times |
Monthly price and charts GoiLoan Strong monthly Stock price targets for GoiLoan 702GS2031_GS are 103.01 and 106.01 | Monthly Target 1 | 100.67 | | Monthly Target 2 | 102.34 | | Monthly Target 3 | 103.67 | | Monthly Target 4 | 105.34 | | Monthly Target 5 | 106.67 |
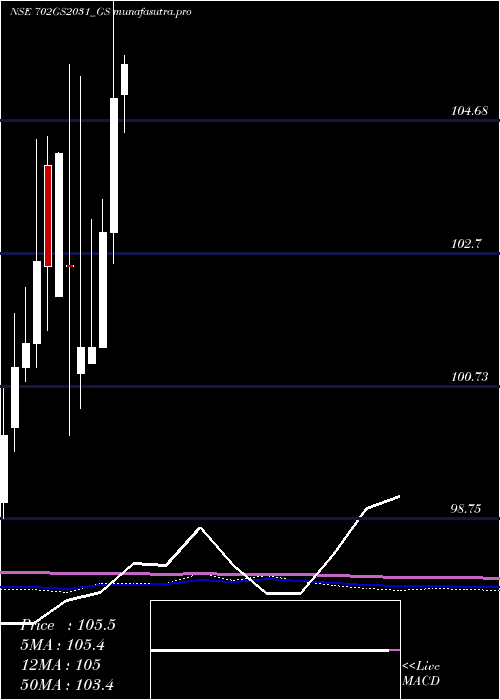
Monthly price and volumes Goi Loan
| Date |
Closing |
Open |
Range |
Volume |
Mon 27 October 2025 |
104.01 (0.78%) |
103.20 |
102.00 - 105.00 |
0.376 times |
Tue 30 September 2025 |
103.20 (-0.19%) |
103.30 |
102.65 - 104.50 |
0.3389 times |
Fri 29 August 2025 |
103.40 (-1.52%) |
105.00 |
102.25 - 105.00 |
0.3327 times |
Thu 31 July 2025 |
105.00 (0.94%) |
104.20 |
102.80 - 105.00 |
1.5996 times |
Mon 30 June 2025 |
104.02 (-3.69%) |
107.35 |
102.70 - 109.00 |
3.9989 times |
Mon 26 May 2025 |
108.00 (2.86%) |
105.06 |
104.45 - 108.00 |
0.1779 times |
Wed 30 April 2025 |
105.00 (1.93%) |
103.01 |
102.55 - 107.15 |
0.5098 times |
Wed 26 March 2025 |
103.01 (1.69%) |
101.30 |
101.30 - 103.50 |
1.5627 times |
Fri 28 February 2025 |
101.30 (0%) |
101.05 |
101.05 - 103.20 |
0.3266 times |
Fri 31 January 2025 |
101.30 (-1.17%) |
100.91 |
100.40 - 105.33 |
0.7769 times |
Tue 31 December 2024 |
102.50 (-1.61%) |
102.51 |
100.00 - 105.50 |
0.9291 times |
DMA SMA EMA moving averages of Goi Loan 702GS2031_GS
DMA (daily moving average) of Goi Loan 702GS2031_GS
| DMA period | DMA value | | 5 day DMA | 104.2 | | 12 day DMA | 103.76 | | 20 day DMA | 103.63 | | 35 day DMA | 103.53 | | 50 day DMA | 103.68 | | 100 day DMA | 104.39 | | 150 day DMA | 103.53 | | 200 day DMA | 103.52 | EMA (exponential moving average) of Goi Loan 702GS2031_GS
| EMA period | EMA current | EMA prev | EMA prev2 | | 5 day EMA | 103.96 | 103.94 | 103.91 | | 12 day EMA | 103.8 | 103.76 | 103.71 | | 20 day EMA | 103.71 | 103.68 | 103.64 | | 35 day EMA | 103.71 | 103.69 | 103.67 | | 50 day EMA | 103.74 | 103.73 | 103.72 |
SMA (simple moving average) of Goi Loan 702GS2031_GS
| SMA period | SMA current | SMA prev | SMA prev2 | | 5 day SMA | 104.2 | 104.04 | 103.74 | | 12 day SMA | 103.76 | 103.66 | 103.59 | | 20 day SMA | 103.63 | 103.61 | 103.56 | | 35 day SMA | 103.53 | 103.5 | 103.48 | | 50 day SMA | 103.68 | 103.68 | 103.68 | | 100 day SMA | 104.39 | 104.39 | 104.37 | | 150 day SMA | 103.53 | 103.52 | 103.52 | | 200 day SMA | 103.52 | 103.52 | 103.51 |
|
|
