GoiLoan 702GS2027_GS full analysis,charts,indicators,moving averages,SMA,DMA,EMA,ADX,MACD,RSIGoi Loan 702GS2027_GS WideScreen charts, DMA,SMA,EMA technical analysis, forecast prediction, by indicators ADX,MACD,RSI,CCI NSE stock exchange
Daily price and charts and targets GoiLoan Strong Daily Stock price targets for GoiLoan 702GS2027_GS are 104.05 and 104.05 | Daily Target 1 | 104.05 | | Daily Target 2 | 104.05 | | Daily Target 3 | 104.05 | | Daily Target 4 | 104.05 | | Daily Target 5 | 104.05 |
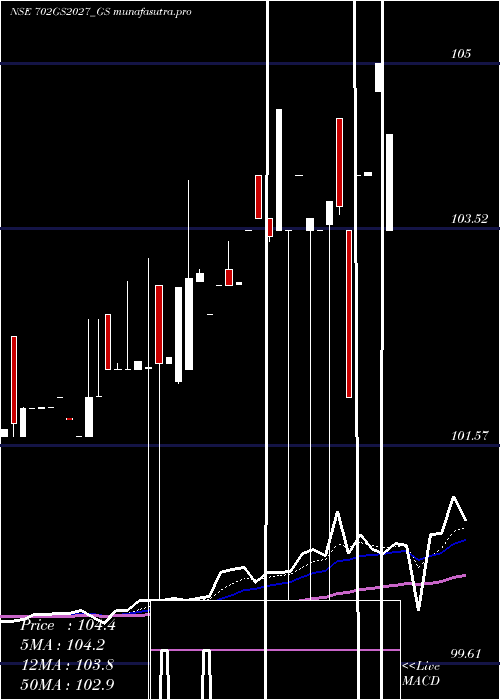
Daily price and volume Goi Loan
| Date |
Closing |
Open |
Range |
Volume |
Tue 28 October 2025 |
104.05 (0%) |
104.05 |
104.05 - 104.05 |
0.3828 times |
Mon 27 October 2025 |
104.05 (0.82%) |
104.00 |
104.00 - 104.05 |
0.8063 times |
Fri 24 October 2025 |
103.20 (-0.39%) |
103.50 |
103.20 - 103.50 |
1.3708 times |
Thu 23 October 2025 |
103.60 (0.39%) |
103.20 |
98.55 - 104.00 |
4.333 times |
Mon 20 October 2025 |
103.20 (-0.05%) |
103.20 |
103.20 - 103.20 |
0.0348 times |
Fri 17 October 2025 |
103.25 (0.24%) |
103.20 |
103.20 - 103.25 |
0.2586 times |
Thu 16 October 2025 |
103.00 (-0.48%) |
103.00 |
98.84 - 103.40 |
1.376 times |
Wed 15 October 2025 |
103.50 (1.42%) |
103.20 |
102.00 - 104.40 |
0.9361 times |
Tue 14 October 2025 |
102.05 (-0.92%) |
103.20 |
100.00 - 104.50 |
0.4858 times |
Mon 13 October 2025 |
103.00 (-0.97%) |
103.00 |
103.00 - 103.00 |
0.0157 times |
Fri 10 October 2025 |
104.01 (0.49%) |
103.00 |
103.00 - 104.45 |
1.1832 times |
Weekly price and charts GoiLoan Strong weekly Stock price targets for GoiLoan 702GS2027_GS are 104.03 and 104.08 | Weekly Target 1 | 103.98 | | Weekly Target 2 | 104.02 | | Weekly Target 3 | 104.03333333333 | | Weekly Target 4 | 104.07 | | Weekly Target 5 | 104.08 |
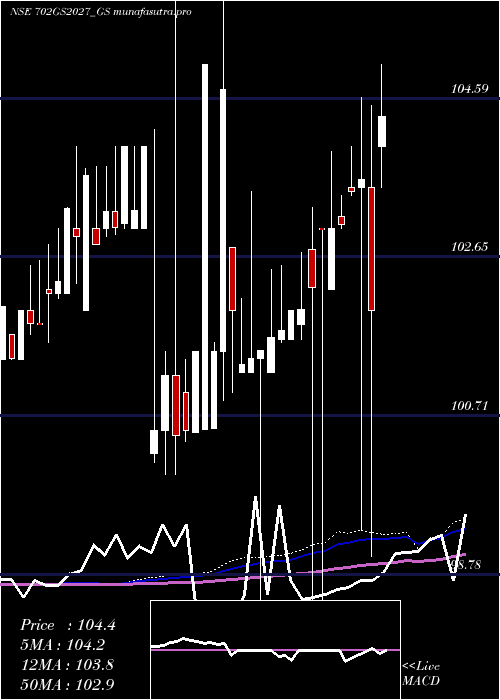
Weekly price and volumes for Goi Loan
| Date |
Closing |
Open |
Range |
Volume |
Tue 28 October 2025 |
104.05 (0.82%) |
104.00 |
104.00 - 104.05 |
0.2251 times |
Fri 24 October 2025 |
103.20 (-0.05%) |
103.20 |
98.55 - 104.00 |
1.0864 times |
Fri 17 October 2025 |
103.25 (-0.73%) |
103.00 |
98.84 - 104.50 |
0.5816 times |
Fri 10 October 2025 |
104.01 (0.98%) |
103.01 |
102.53 - 104.45 |
1.962 times |
Fri 03 October 2025 |
103.00 (-0.15%) |
102.70 |
102.70 - 103.20 |
1.7787 times |
Fri 26 September 2025 |
103.15 (0.29%) |
102.80 |
98.07 - 104.25 |
0.8032 times |
Fri 19 September 2025 |
102.85 (-1.01%) |
102.70 |
102.70 - 103.00 |
0.7825 times |
Fri 12 September 2025 |
103.90 (1.17%) |
102.70 |
102.70 - 104.00 |
0.4934 times |
Fri 05 September 2025 |
102.70 (0%) |
102.70 |
98.07 - 103.75 |
1.2817 times |
Fri 29 August 2025 |
102.70 (0.09%) |
102.46 |
102.41 - 102.80 |
1.0053 times |
Fri 22 August 2025 |
102.61 (0.16%) |
102.25 |
102.25 - 102.61 |
0.1245 times |
Monthly price and charts GoiLoan Strong monthly Stock price targets for GoiLoan 702GS2027_GS are 101.3 and 107.25 | Monthly Target 1 | 96.42 | | Monthly Target 2 | 100.23 | | Monthly Target 3 | 102.36666666667 | | Monthly Target 4 | 106.18 | | Monthly Target 5 | 108.32 |
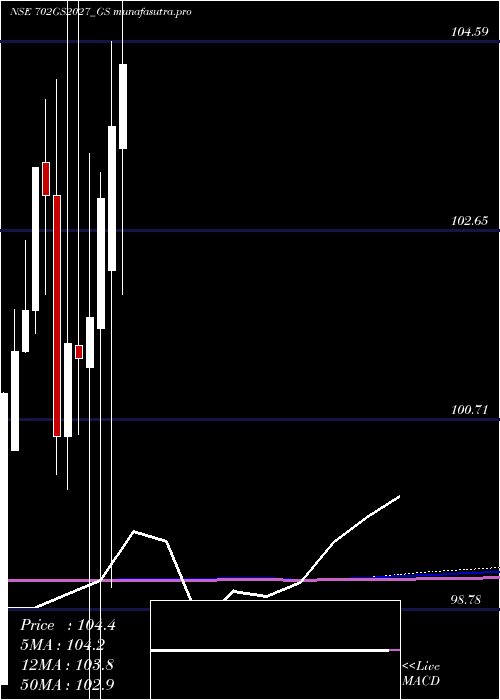
Monthly price and volumes Goi Loan
| Date |
Closing |
Open |
Range |
Volume |
Tue 28 October 2025 |
104.05 (0.96%) |
103.07 |
98.55 - 104.50 |
0.6302 times |
Tue 30 September 2025 |
103.06 (0.35%) |
102.70 |
98.07 - 104.25 |
0.6391 times |
Fri 29 August 2025 |
102.70 (-0.68%) |
103.48 |
102.25 - 103.48 |
0.2 times |
Thu 31 July 2025 |
103.40 (1.37%) |
102.26 |
97.70 - 103.40 |
0.7546 times |
Mon 30 June 2025 |
102.00 (-0.24%) |
102.50 |
101.65 - 103.00 |
1.1716 times |
Fri 30 May 2025 |
102.25 (-1.42%) |
103.50 |
99.66 - 105.00 |
1.634 times |
Wed 30 April 2025 |
103.72 (0.72%) |
102.25 |
99.00 - 104.59 |
1.4259 times |
Wed 26 March 2025 |
102.98 (1.2%) |
101.65 |
97.66 - 103.25 |
1.727 times |
Fri 28 February 2025 |
101.76 (0.41%) |
101.25 |
96.84 - 103.44 |
1.3408 times |
Fri 31 January 2025 |
101.34 (-0.16%) |
101.48 |
100.56 - 106.00 |
0.4767 times |
Tue 31 December 2024 |
101.50 (0.95%) |
100.54 |
100.00 - 106.26 |
1.4564 times |
DMA SMA EMA moving averages of Goi Loan 702GS2027_GS
DMA (daily moving average) of Goi Loan 702GS2027_GS
| DMA period | DMA value | | 5 day DMA | 103.62 | | 12 day DMA | 103.37 | | 20 day DMA | 103.21 | | 35 day DMA | 103.07 | | 50 day DMA | 102.94 | | 100 day DMA | 102.89 | | 150 day DMA | 102.74 | | 200 day DMA | 102.52 | EMA (exponential moving average) of Goi Loan 702GS2027_GS
| EMA period | EMA current | EMA prev | EMA prev2 | | 5 day EMA | 103.7 | 103.53 | 103.27 | | 12 day EMA | 103.42 | 103.3 | 103.16 | | 20 day EMA | 103.26 | 103.18 | 103.09 | | 35 day EMA | 103.12 | 103.06 | 103 | | 50 day EMA | 102.97 | 102.93 | 102.88 |
SMA (simple moving average) of Goi Loan 702GS2027_GS
| SMA period | SMA current | SMA prev | SMA prev2 | | 5 day SMA | 103.62 | 103.46 | 103.25 | | 12 day SMA | 103.37 | 103.24 | 103.15 | | 20 day SMA | 103.21 | 103.07 | 103 | | 35 day SMA | 103.07 | 103.03 | 102.99 | | 50 day SMA | 102.94 | 102.92 | 102.89 | | 100 day SMA | 102.89 | 102.87 | 102.86 | | 150 day SMA | 102.74 | 102.73 | 102.71 | | 200 day SMA | 102.52 | 102.51 | 102.51 |
|
|
