GoiLoan 699GS2051_GS full analysis,charts,indicators,moving averages,SMA,DMA,EMA,ADX,MACD,RSIGoi Loan 699GS2051_GS WideScreen charts, DMA,SMA,EMA technical analysis, forecast prediction, by indicators ADX,MACD,RSI,CCI NSE stock exchange
Daily price and charts and targets GoiLoan Strong Daily Stock price targets for GoiLoan 699GS2051_GS are 99.99 and 100 | Daily Target 1 | 99.98 | | Daily Target 2 | 99.99 | | Daily Target 3 | 99.993333333333 | | Daily Target 4 | 100 | | Daily Target 5 | 100 |
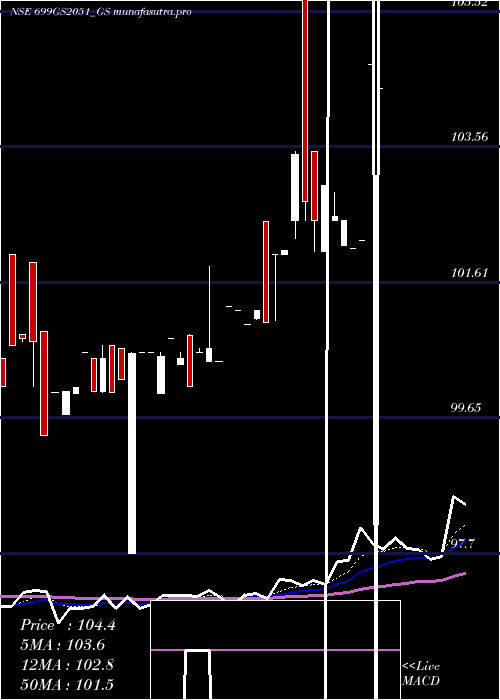
Daily price and volume Goi Loan
| Date |
Closing |
Open |
Range |
Volume |
Tue 28 October 2025 |
99.99 (-0.51%) |
100.00 |
99.99 - 100.00 |
5.7789 times |
Mon 27 October 2025 |
100.50 (0.4%) |
100.70 |
100.45 - 100.70 |
0.9117 times |
Fri 24 October 2025 |
100.10 (0.2%) |
100.10 |
100.10 - 100.10 |
0.0703 times |
Thu 23 October 2025 |
99.90 (-0.21%) |
99.90 |
99.90 - 99.90 |
0.0781 times |
Mon 20 October 2025 |
100.11 (-0.88%) |
101.11 |
100.11 - 101.11 |
1.4323 times |
Fri 17 October 2025 |
101.00 (0.25%) |
100.50 |
100.40 - 101.00 |
0.8542 times |
Thu 16 October 2025 |
100.75 (-0.25%) |
100.75 |
100.75 - 100.75 |
0.0253 times |
Wed 15 October 2025 |
101.00 (2.02%) |
100.50 |
100.50 - 101.00 |
0.8227 times |
Tue 14 October 2025 |
99.00 (-1%) |
99.00 |
99.00 - 99.00 |
0.0263 times |
Fri 10 October 2025 |
100.00 (0.73%) |
100.00 |
100.00 - 100.00 |
0.0003 times |
Wed 08 October 2025 |
99.28 (-0.72%) |
99.28 |
99.28 - 99.28 |
2.6042 times |
Weekly price and charts GoiLoan Strong weekly Stock price targets for GoiLoan 699GS2051_GS are 99.64 and 100.35 | Weekly Target 1 | 99.52 | | Weekly Target 2 | 99.75 | | Weekly Target 3 | 100.22666666667 | | Weekly Target 4 | 100.46 | | Weekly Target 5 | 100.94 |
Weekly price and volumes for Goi Loan
| Date |
Closing |
Open |
Range |
Volume |
Tue 28 October 2025 |
99.99 (-0.11%) |
100.70 |
99.99 - 100.70 |
3.0504 times |
Fri 24 October 2025 |
100.10 (-0.89%) |
101.11 |
99.90 - 101.11 |
0.7207 times |
Fri 17 October 2025 |
101.00 (1%) |
99.00 |
99.00 - 101.00 |
0.788 times |
Fri 10 October 2025 |
100.00 (-0.89%) |
100.90 |
99.00 - 100.90 |
1.475 times |
Fri 03 October 2025 |
100.90 (0.4%) |
100.50 |
100.50 - 101.00 |
1.1071 times |
Fri 26 September 2025 |
100.50 (1.57%) |
96.47 |
96.47 - 101.00 |
1.1921 times |
Tue 16 September 2025 |
98.95 (-2.03%) |
101.00 |
98.95 - 103.55 |
0.0331 times |
Fri 12 September 2025 |
101.00 (2.02%) |
101.47 |
98.93 - 101.75 |
0.0395 times |
Fri 05 September 2025 |
99.00 (-1.24%) |
100.00 |
96.85 - 100.00 |
0.0844 times |
Fri 29 August 2025 |
100.24 (0.24%) |
100.00 |
99.05 - 104.00 |
1.5096 times |
Wed 13 August 2025 |
100.00 (-2.9%) |
101.00 |
100.00 - 101.50 |
0.109 times |

Monthly price and charts GoiLoan Strong monthly Stock price targets for GoiLoan 699GS2051_GS are 98.44 and 100.55 | Monthly Target 1 | 97.92 | | Monthly Target 2 | 98.96 | | Monthly Target 3 | 100.03333333333 | | Monthly Target 4 | 101.07 | | Monthly Target 5 | 102.14 |
Monthly price and volumes Goi Loan
| Date |
Closing |
Open |
Range |
Volume |
Tue 28 October 2025 |
99.99 (-0.51%) |
101.00 |
99.00 - 101.11 |
0.5337 times |
Tue 30 September 2025 |
100.50 (0.26%) |
100.00 |
96.47 - 103.55 |
0.1383 times |
Fri 29 August 2025 |
100.24 (-2.67%) |
101.00 |
99.05 - 104.00 |
0.2491 times |
Thu 31 July 2025 |
102.99 (2.99%) |
101.99 |
98.47 - 103.52 |
1.3786 times |
Mon 30 June 2025 |
100.00 (-4.76%) |
104.80 |
100.00 - 106.15 |
1.5483 times |
Fri 30 May 2025 |
105.00 (0.97%) |
103.99 |
102.50 - 107.00 |
0.9585 times |
Wed 30 April 2025 |
103.99 (2.93%) |
102.00 |
101.05 - 106.75 |
1.4155 times |
Fri 28 March 2025 |
101.03 (0.83%) |
97.70 |
97.70 - 102.49 |
0.4517 times |
Fri 28 February 2025 |
100.20 (-0.05%) |
100.50 |
99.40 - 102.00 |
2.3259 times |
Fri 31 January 2025 |
100.25 (0.93%) |
99.50 |
97.02 - 101.00 |
1.0004 times |
Tue 31 December 2024 |
99.33 (-1.83%) |
101.50 |
98.20 - 103.50 |
1.5932 times |

DMA SMA EMA moving averages of Goi Loan 699GS2051_GS
DMA (daily moving average) of Goi Loan 699GS2051_GS
| DMA period | DMA value | | 5 day DMA | 100.12 | | 12 day DMA | 100.14 | | 20 day DMA | 100.05 | | 35 day DMA | 100.2 | | 50 day DMA | 100.5 | | 100 day DMA | 101.69 | | 150 day DMA | 101.71 | | 200 day DMA | 101.52 | EMA (exponential moving average) of Goi Loan 699GS2051_GS
| EMA period | EMA current | EMA prev | EMA prev2 | | 5 day EMA | 100.19 | 100.29 | 100.19 | | 12 day EMA | 100.21 | 100.25 | 100.2 | | 20 day EMA | 100.23 | 100.26 | 100.23 | | 35 day EMA | 100.35 | 100.37 | 100.36 | | 50 day EMA | 100.5 | 100.52 | 100.52 |
SMA (simple moving average) of Goi Loan 699GS2051_GS
| SMA period | SMA current | SMA prev | SMA prev2 | | 5 day SMA | 100.12 | 100.32 | 100.37 | | 12 day SMA | 100.14 | 100.21 | 100.25 | | 20 day SMA | 100.05 | 99.99 | 100.02 | | 35 day SMA | 100.2 | 100.23 | 100.3 | | 50 day SMA | 100.5 | 100.53 | 100.54 | | 100 day SMA | 101.69 | 101.76 | 101.79 | | 150 day SMA | 101.71 | 101.72 | 101.71 | | 200 day SMA | 101.52 | 101.54 | 101.54 |
|
|
