GoiLoan 698GR2054_GS full analysis,charts,indicators,moving averages,SMA,DMA,EMA,ADX,MACD,RSIGoi Loan 698GR2054_GS WideScreen charts, DMA,SMA,EMA technical analysis, forecast prediction, by indicators ADX,MACD,RSI,CCI NSE stock exchange
Daily price and charts and targets GoiLoan Strong Daily Stock price targets for GoiLoan 698GR2054_GS are 100.49 and 100.49 | Daily Target 1 | 100.49 | | Daily Target 2 | 100.49 | | Daily Target 3 | 100.49 | | Daily Target 4 | 100.49 | | Daily Target 5 | 100.49 |
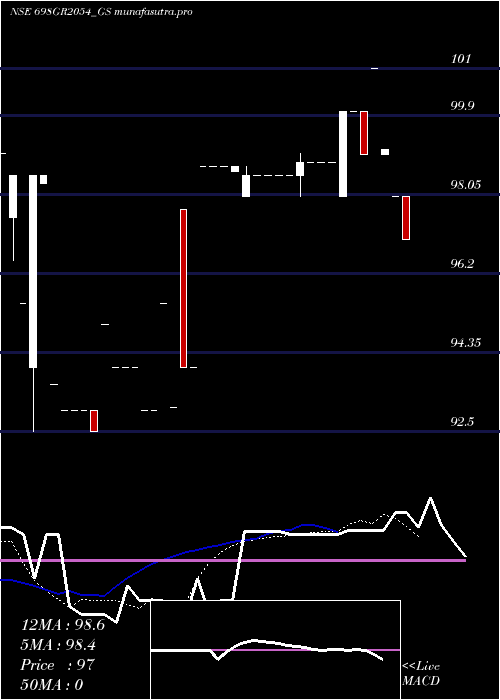
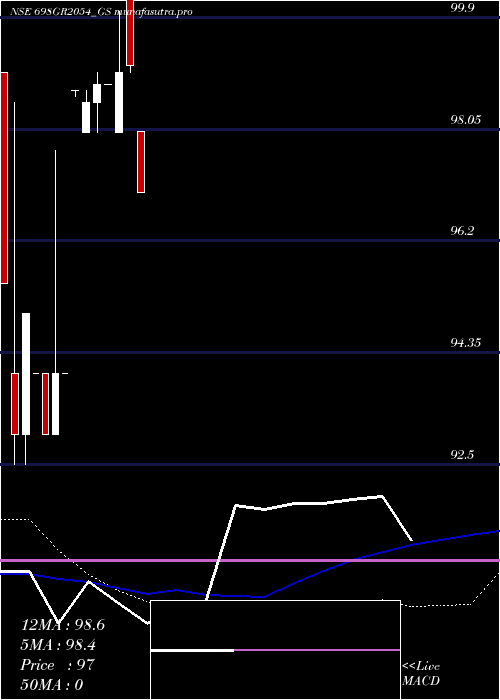
Daily price and volume Goi Loan
| Date |
Closing |
Open |
Range |
Volume |
Wed 29 October 2025 |
100.49 (2.56%) |
100.49 |
100.49 - 100.49 |
0.0037 times |
Tue 28 October 2025 |
97.98 (-2%) |
97.98 |
97.98 - 97.98 |
1.4804 times |
Mon 27 October 2025 |
99.98 (0.99%) |
99.98 |
99.98 - 99.98 |
1.4804 times |
Fri 24 October 2025 |
99.00 (1.04%) |
97.98 |
97.98 - 99.00 |
0.7402 times |
Thu 23 October 2025 |
97.98 (-2%) |
97.98 |
97.98 - 97.98 |
0.3701 times |
Mon 20 October 2025 |
99.98 (-0.01%) |
99.98 |
99.98 - 99.98 |
1.5914 times |
Thu 16 October 2025 |
99.99 (3.06%) |
99.99 |
99.99 - 99.99 |
0.6477 times |
Wed 15 October 2025 |
97.02 (-2%) |
99.00 |
97.02 - 99.00 |
0.7402 times |
Tue 14 October 2025 |
99.00 (1.54%) |
97.50 |
97.50 - 99.00 |
1.4656 times |
Mon 13 October 2025 |
97.50 (2.55%) |
99.80 |
97.50 - 99.80 |
1.4804 times |
Fri 10 October 2025 |
95.08 (0%) |
95.08 |
95.08 - 95.08 |
0.3701 times |
Weekly price and charts GoiLoan Strong weekly Stock price targets for GoiLoan 698GR2054_GS are 99.24 and 101.75 | Weekly Target 1 | 97.14 | | Weekly Target 2 | 98.82 | | Weekly Target 3 | 99.653333333333 | | Weekly Target 4 | 101.33 | | Weekly Target 5 | 102.16 |
Weekly price and volumes for Goi Loan
| Date |
Closing |
Open |
Range |
Volume |
Wed 29 October 2025 |
100.49 (1.51%) |
99.98 |
97.98 - 100.49 |
0.4516 times |
Fri 24 October 2025 |
99.00 (-0.99%) |
99.98 |
97.98 - 99.98 |
0.4116 times |
Thu 16 October 2025 |
99.99 (5.16%) |
99.80 |
97.02 - 99.99 |
0.6602 times |
Fri 10 October 2025 |
95.08 (-2%) |
97.02 |
95.08 - 97.02 |
0.3383 times |
Wed 24 September 2025 |
97.02 (-2%) |
99.00 |
97.02 - 99.00 |
0.1111 times |
Fri 19 September 2025 |
99.00 (-0.48%) |
101.96 |
99.00 - 101.96 |
6.2049 times |
Fri 12 September 2025 |
99.48 (-0.11%) |
100.75 |
94.75 - 100.75 |
0.3828 times |
Thu 04 September 2025 |
99.59 (1.62%) |
99.00 |
98.99 - 99.59 |
1.0448 times |
Thu 21 August 2025 |
98.00 (-0.02%) |
98.00 |
98.00 - 99.00 |
0.2255 times |
Tue 12 August 2025 |
98.02 (0%) |
98.02 |
98.02 - 98.02 |
0.1691 times |
Wed 30 July 2025 |
98.02 (0.93%) |
98.02 |
98.02 - 98.02 |
0.0564 times |
Monthly price and charts GoiLoan Strong monthly Stock price targets for GoiLoan 698GR2054_GS are 97.79 and 103.2 | Monthly Target 1 | 93.28 | | Monthly Target 2 | 96.88 | | Monthly Target 3 | 98.686666666667 | | Monthly Target 4 | 102.29 | | Monthly Target 5 | 104.1 |
Monthly price and volumes Goi Loan
| Date |
Closing |
Open |
Range |
Volume |
Wed 29 October 2025 |
100.49 (5.69%) |
95.08 |
95.08 - 100.49 |
0.7024 times |
Mon 29 September 2025 |
95.08 (-3.95%) |
98.99 |
94.75 - 101.96 |
2.8508 times |
Mon 25 August 2025 |
98.99 (0.99%) |
98.02 |
98.00 - 99.00 |
0.5966 times |
Wed 30 July 2025 |
98.02 (-2.37%) |
100.00 |
97.12 - 100.10 |
0.5148 times |
Mon 30 June 2025 |
100.40 (0.3%) |
100.01 |
99.00 - 104.58 |
0.7253 times |
Fri 30 May 2025 |
100.10 (1.01%) |
98.01 |
97.00 - 100.20 |
1.0719 times |
Tue 29 April 2025 |
99.10 (0.61%) |
98.50 |
98.00 - 101.00 |
1.1163 times |
Tue 25 March 2025 |
98.50 (4.79%) |
94.00 |
94.00 - 98.70 |
1.4507 times |
Fri 28 February 2025 |
94.00 (-1.05%) |
94.00 |
93.00 - 97.70 |
0.2038 times |
Fri 31 January 2025 |
95.00 (0%) |
99.00 |
92.50 - 99.00 |
0.7674 times |
Wed 29 October 2025 |
(0%) |
|
- |
0 times |

DMA SMA EMA moving averages of Goi Loan 698GR2054_GS
DMA (daily moving average) of Goi Loan 698GR2054_GS
| DMA period | DMA value | | 5 day DMA | 99.09 | | 12 day DMA | 98.26 | | 20 day DMA | 98.11 | | 35 day DMA | 98.22 | | 50 day DMA | 98.88 | | 100 day DMA | | | 150 day DMA | | | 200 day DMA | | EMA (exponential moving average) of Goi Loan 698GR2054_GS
| EMA period | EMA current | EMA prev | EMA prev2 | | 5 day EMA | 99.31 | 98.72 | 99.09 | | 12 day EMA | 98.68 | 98.35 | 98.42 | | 20 day EMA | 98.46 | 98.25 | 98.28 | | 35 day EMA | 98.63 | 98.52 | 98.55 | | 50 day EMA | 98.97 | 98.91 | 98.95 |
SMA (simple moving average) of Goi Loan 698GR2054_GS
| SMA period | SMA current | SMA prev | SMA prev2 | | 5 day SMA | 99.09 | 98.98 | 99.39 | | 12 day SMA | 98.26 | 97.81 | 97.56 | | 20 day SMA | 98.11 | 98.06 | 97.9 | | 35 day SMA | 98.22 | 98.22 | 98.29 | | 50 day SMA | 98.88 | 98.87 | 98.91 | | 100 day SMA | | 150 day SMA | | 200 day SMA |
|
|
