GoiLoan 679GS2031_GS full analysis,charts,indicators,moving averages,SMA,DMA,EMA,ADX,MACD,RSIGoi Loan 679GS2031_GS WideScreen charts, DMA,SMA,EMA technical analysis, forecast prediction, by indicators ADX,MACD,RSI,CCI NSE stock exchange
Daily price and charts and targets GoiLoan Strong Daily Stock price targets for GoiLoan 679GS2031_GS are 103.78 and 104.93 | Daily Target 1 | 102.82 | | Daily Target 2 | 103.58 | | Daily Target 3 | 103.96666666667 | | Daily Target 4 | 104.73 | | Daily Target 5 | 105.12 |
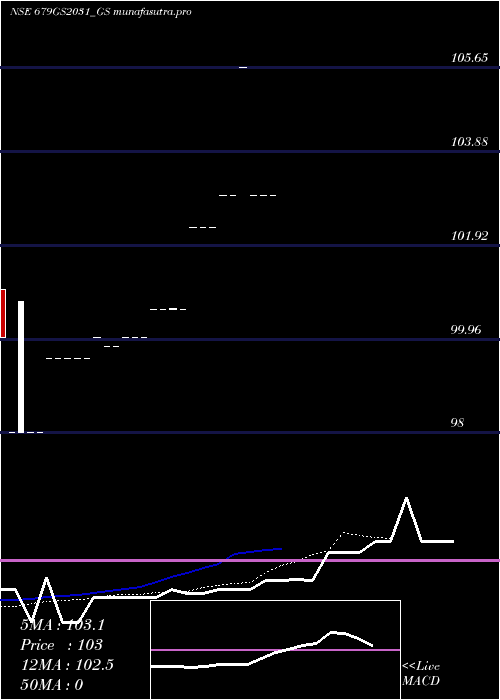
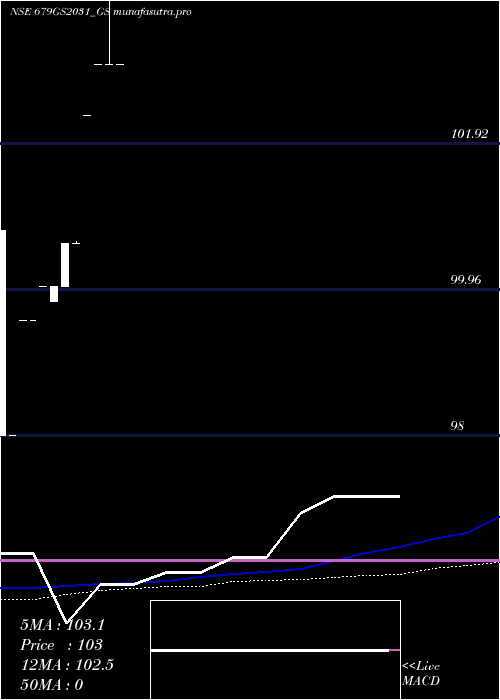
Daily price and volume Goi Loan
| Date |
Closing |
Open |
Range |
Volume |
Wed 29 October 2025 |
104.35 (-0.14%) |
103.20 |
103.20 - 104.35 |
2.7561 times |
Tue 28 October 2025 |
104.50 (0%) |
103.46 |
103.46 - 104.50 |
0.2781 times |
Mon 27 October 2025 |
104.50 (0%) |
104.50 |
104.50 - 104.50 |
2.8827 times |
Fri 24 October 2025 |
104.50 (0%) |
102.80 |
102.80 - 104.50 |
0.2781 times |
Thu 23 October 2025 |
104.50 (0.48%) |
104.50 |
104.50 - 104.50 |
0.0028 times |
Mon 20 October 2025 |
104.00 (-0.19%) |
103.16 |
103.16 - 104.00 |
0.2781 times |
Thu 16 October 2025 |
104.20 (0.19%) |
104.20 |
104.20 - 104.20 |
0.0028 times |
Wed 15 October 2025 |
104.00 (-0.19%) |
101.85 |
101.85 - 104.20 |
2.7808 times |
Mon 13 October 2025 |
104.20 (0%) |
104.20 |
104.20 - 104.20 |
0.4626 times |
Thu 09 October 2025 |
104.20 (0%) |
103.16 |
103.16 - 104.20 |
0.2781 times |
Tue 07 October 2025 |
104.20 (-1.75%) |
101.85 |
101.85 - 104.20 |
0.5534 times |
Weekly price and charts GoiLoan Strong weekly Stock price targets for GoiLoan 679GS2031_GS are 103.13 and 104.43 | Weekly Target 1 | 102.72 | | Weekly Target 2 | 103.53 | | Weekly Target 3 | 104.01666666667 | | Weekly Target 4 | 104.83 | | Weekly Target 5 | 105.32 |
Weekly price and volumes for Goi Loan
| Date |
Closing |
Open |
Range |
Volume |
Wed 29 October 2025 |
104.35 (-0.14%) |
104.50 |
103.20 - 104.50 |
4.0123 times |
Fri 24 October 2025 |
104.50 (0.29%) |
103.16 |
102.80 - 104.50 |
0.379 times |
Thu 16 October 2025 |
104.20 (0%) |
104.20 |
101.85 - 104.20 |
2.2013 times |
Thu 09 October 2025 |
104.20 (-0.29%) |
106.06 |
101.85 - 106.06 |
0.6516 times |
Fri 03 October 2025 |
104.50 (2.2%) |
101.35 |
101.35 - 104.50 |
1.3536 times |
Fri 26 September 2025 |
102.25 (-4.05%) |
105.50 |
101.35 - 105.50 |
0.6609 times |
Mon 15 September 2025 |
106.57 (1.5%) |
106.57 |
106.57 - 106.57 |
0.0878 times |
Thu 11 September 2025 |
105.00 (0.96%) |
105.56 |
103.00 - 105.56 |
0.3753 times |
Fri 05 September 2025 |
104.00 (2.61%) |
104.00 |
104.00 - 104.00 |
0.0019 times |
Fri 29 August 2025 |
101.35 (-2.45%) |
103.50 |
101.35 - 103.50 |
0.2763 times |
Thu 21 August 2025 |
103.90 (0.92%) |
102.15 |
101.00 - 104.00 |
5.3473 times |
Monthly price and charts GoiLoan Strong monthly Stock price targets for GoiLoan 679GS2031_GS are 103.1 and 107.31 | Monthly Target 1 | 99.88 | | Monthly Target 2 | 102.11 | | Monthly Target 3 | 104.08666666667 | | Monthly Target 4 | 106.32 | | Monthly Target 5 | 108.3 |
Monthly price and volumes Goi Loan
| Date |
Closing |
Open |
Range |
Volume |
Wed 29 October 2025 |
104.35 (0.72%) |
102.56 |
101.85 - 106.06 |
0.1137 times |
Tue 30 September 2025 |
103.60 (2.22%) |
104.00 |
101.35 - 106.57 |
0.0314 times |
Fri 29 August 2025 |
101.35 (-2.41%) |
102.50 |
101.00 - 104.00 |
0.4448 times |
Wed 30 July 2025 |
103.85 (0.83%) |
103.00 |
101.97 - 103.85 |
2.6153 times |
Mon 30 June 2025 |
103.00 (-1.58%) |
104.65 |
101.90 - 107.56 |
6.2429 times |
Thu 29 May 2025 |
104.65 (1.62%) |
102.98 |
102.98 - 106.50 |
0.2842 times |
Tue 29 April 2025 |
102.98 (2.39%) |
100.58 |
100.58 - 105.65 |
0.1811 times |
Thu 20 March 2025 |
100.58 (0.78%) |
99.80 |
99.80 - 100.58 |
0.0223 times |
Mon 24 February 2025 |
99.80 (1.84%) |
99.55 |
99.55 - 100.00 |
0.0502 times |
Thu 23 January 2025 |
98.00 (0%) |
101.00 |
98.00 - 101.00 |
0.014 times |
Wed 29 October 2025 |
(0%) |
|
- |
0 times |

DMA SMA EMA moving averages of Goi Loan 679GS2031_GS
DMA (daily moving average) of Goi Loan 679GS2031_GS
| DMA period | DMA value | | 5 day DMA | 104.47 | | 12 day DMA | 104.43 | | 20 day DMA | 104.45 | | 35 day DMA | 103.82 | | 50 day DMA | 103.56 | | 100 day DMA | | | 150 day DMA | | | 200 day DMA | | EMA (exponential moving average) of Goi Loan 679GS2031_GS
| EMA period | EMA current | EMA prev | EMA prev2 | | 5 day EMA | 104.4 | 104.43 | 104.4 | | 12 day EMA | 104.32 | 104.32 | 104.29 | | 20 day EMA | 104.21 | 104.2 | 104.17 | | 35 day EMA | 104.02 | 104 | 103.97 | | 50 day EMA | 103.74 | 103.72 | 103.69 |
SMA (simple moving average) of Goi Loan 679GS2031_GS
| SMA period | SMA current | SMA prev | SMA prev2 | | 5 day SMA | 104.47 | 104.4 | 104.34 | | 12 day SMA | 104.43 | 104.45 | 104.37 | | 20 day SMA | 104.45 | 104.44 | 104.28 | | 35 day SMA | 103.82 | 103.8 | 103.78 | | 50 day SMA | 103.56 | 103.53 | 103.54 | | 100 day SMA | | 150 day SMA | | 200 day SMA |
|
|
