GoiLoan 668GS2040_GS full analysis,charts,indicators,moving averages,SMA,DMA,EMA,ADX,MACD,RSIGoi Loan 668GS2040_GS WideScreen charts, DMA,SMA,EMA technical analysis, forecast prediction, by indicators ADX,MACD,RSI,CCI NSE stock exchange
Daily price and charts and targets GoiLoan Strong Daily Stock price targets for GoiLoan 668GS2040_GS are 100.51 and 101.51 | Daily Target 1 | 99.68 | | Daily Target 2 | 100.34 | | Daily Target 3 | 100.67666666667 | | Daily Target 4 | 101.34 | | Daily Target 5 | 101.68 |
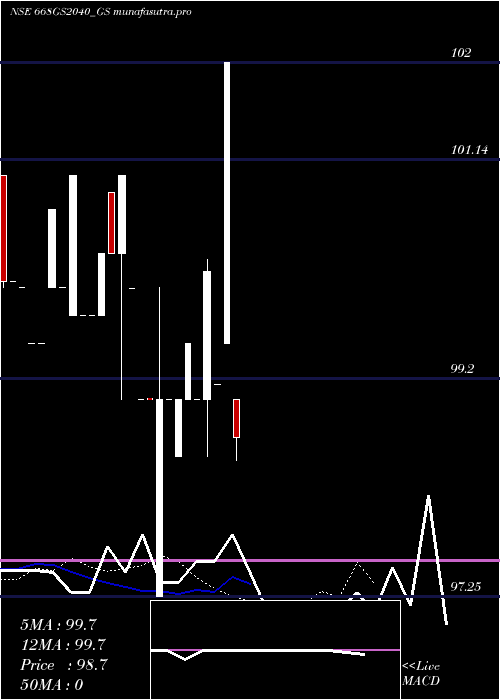
Daily price and volume Goi Loan
| Date |
Closing |
Open |
Range |
Volume |
Tue 28 October 2025 |
101.01 (1%) |
100.01 |
100.01 - 101.01 |
4.4776 times |
Mon 27 October 2025 |
100.01 (0.46%) |
100.00 |
100.00 - 100.01 |
0.0694 times |
Fri 24 October 2025 |
99.55 (-0.76%) |
100.31 |
99.55 - 100.31 |
0.1041 times |
Thu 23 October 2025 |
100.31 (-0.19%) |
100.50 |
100.25 - 100.50 |
0.6248 times |
Mon 20 October 2025 |
100.50 (0%) |
100.50 |
100.50 - 100.50 |
0.1388 times |
Fri 17 October 2025 |
100.50 (0%) |
100.50 |
100.50 - 100.50 |
0.0694 times |
Thu 16 October 2025 |
100.50 (0.1%) |
100.40 |
100.40 - 100.50 |
0.21 times |
Wed 15 October 2025 |
100.40 (0.5%) |
98.00 |
98.00 - 100.50 |
0.2777 times |
Tue 14 October 2025 |
99.90 (-0.1%) |
100.00 |
99.80 - 100.05 |
1.4249 times |
Fri 10 October 2025 |
100.00 (2.04%) |
100.50 |
99.60 - 100.50 |
2.6033 times |
Thu 09 October 2025 |
98.00 (-1.41%) |
98.00 |
98.00 - 98.00 |
0.1736 times |
Weekly price and charts GoiLoan Strong weekly Stock price targets for GoiLoan 668GS2040_GS are 100.51 and 101.52 | Weekly Target 1 | 99.66 | | Weekly Target 2 | 100.34 | | Weekly Target 3 | 100.67333333333 | | Weekly Target 4 | 101.35 | | Weekly Target 5 | 101.68 |
Weekly price and volumes for Goi Loan
| Date |
Closing |
Open |
Range |
Volume |
Tue 28 October 2025 |
101.01 (1.47%) |
100.00 |
100.00 - 101.01 |
1.9952 times |
Fri 24 October 2025 |
99.55 (-0.95%) |
100.50 |
99.55 - 100.50 |
0.3808 times |
Fri 17 October 2025 |
100.50 (0.5%) |
100.00 |
98.00 - 100.50 |
0.8697 times |
Fri 10 October 2025 |
100.00 (0.2%) |
99.80 |
98.00 - 100.50 |
1.3411 times |
Fri 03 October 2025 |
99.80 (-0.2%) |
100.20 |
99.20 - 100.20 |
1.3872 times |
Fri 26 September 2025 |
100.00 (1.01%) |
98.90 |
98.90 - 100.00 |
0.1675 times |
Fri 19 September 2025 |
99.00 (0%) |
99.00 |
98.85 - 99.00 |
0.7765 times |
Fri 12 September 2025 |
99.00 (0.33%) |
98.00 |
96.82 - 99.00 |
0.1528 times |
Fri 05 September 2025 |
98.67 (-0.47%) |
99.50 |
98.46 - 102.00 |
0.11 times |
Fri 29 August 2025 |
99.14 (0.14%) |
99.00 |
98.50 - 100.25 |
2.8192 times |
Fri 22 August 2025 |
99.00 (0%) |
97.25 |
97.25 - 100.00 |
0.1218 times |

Monthly price and charts GoiLoan Strong monthly Stock price targets for GoiLoan 668GS2040_GS are 99.51 and 102.52 | Monthly Target 1 | 97 | | Monthly Target 2 | 99 | | Monthly Target 3 | 100.00666666667 | | Monthly Target 4 | 102.01 | | Monthly Target 5 | 103.02 |
Monthly price and volumes Goi Loan
| Date |
Closing |
Open |
Range |
Volume |
Tue 28 October 2025 |
101.01 (1.01%) |
99.90 |
98.00 - 101.01 |
1.8786 times |
Tue 30 September 2025 |
100.00 (0.87%) |
99.50 |
96.82 - 102.00 |
0.5405 times |
Fri 29 August 2025 |
99.14 (-0.61%) |
99.75 |
97.25 - 101.00 |
1.2576 times |
Tue 29 July 2025 |
99.75 (0%) |
101.00 |
99.50 - 101.00 |
0.3234 times |
Tue 28 October 2025 |
(0%) |
|
- |
0 times |

DMA SMA EMA moving averages of Goi Loan 668GS2040_GS
DMA (daily moving average) of Goi Loan 668GS2040_GS
| DMA period | DMA value | | 5 day DMA | 100.28 | | 12 day DMA | 100.01 | | 20 day DMA | 99.92 | | 35 day DMA | 99.57 | | 50 day DMA | 99.64 | | 100 day DMA | | | 150 day DMA | | | 200 day DMA | | EMA (exponential moving average) of Goi Loan 668GS2040_GS
| EMA period | EMA current | EMA prev | EMA prev2 | | 5 day EMA | 100.36 | 100.04 | 100.06 | | 12 day EMA | 100.12 | 99.96 | 99.95 | | 20 day EMA | 99.95 | 99.84 | 99.82 | | 35 day EMA | 99.85 | 99.78 | 99.77 | | 50 day EMA | 99.73 | 99.68 | 99.67 |
SMA (simple moving average) of Goi Loan 668GS2040_GS
| SMA period | SMA current | SMA prev | SMA prev2 | | 5 day SMA | 100.28 | 100.17 | 100.27 | | 12 day SMA | 100.01 | 99.91 | 99.89 | | 20 day SMA | 99.92 | 99.82 | 99.77 | | 35 day SMA | 99.57 | 99.53 | 99.5 | | 50 day SMA | 99.64 | 99.61 | 99.6 | | 100 day SMA | | 150 day SMA | | 200 day SMA |
|
|
