GoiLoan 667GS2050_GS full analysis,charts,indicators,moving averages,SMA,DMA,EMA,ADX,MACD,RSIGoi Loan 667GS2050_GS WideScreen charts, DMA,SMA,EMA technical analysis, forecast prediction, by indicators ADX,MACD,RSI,CCI NSE stock exchange
Daily price and charts and targets GoiLoan Strong Daily Stock price targets for GoiLoan 667GS2050_GS are 96.01 and 96.34 | Daily Target 1 | 95.91 | | Daily Target 2 | 96.1 | | Daily Target 3 | 96.243333333333 | | Daily Target 4 | 96.43 | | Daily Target 5 | 96.57 |
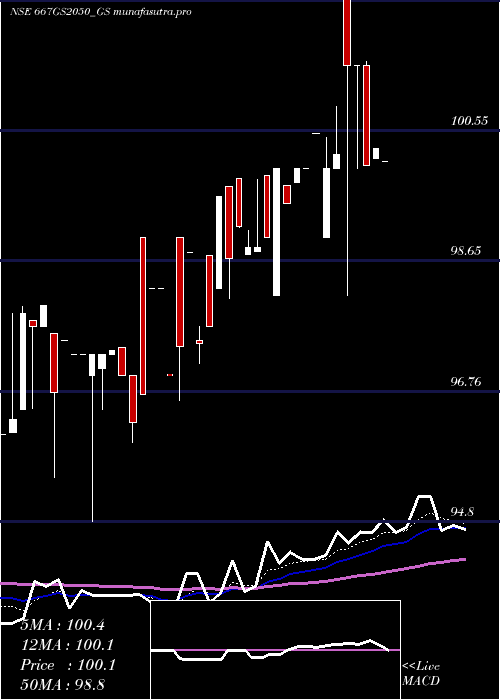
Daily price and volume Goi Loan
| Date |
Closing |
Open |
Range |
Volume |
Tue 28 October 2025 |
96.28 (-0.23%) |
96.39 |
96.06 - 96.39 |
0.0207 times |
Mon 27 October 2025 |
96.50 (-0.41%) |
96.50 |
96.50 - 96.50 |
0.0254 times |
Fri 24 October 2025 |
96.90 (0.41%) |
96.90 |
96.90 - 96.90 |
0.1058 times |
Thu 23 October 2025 |
96.50 (0.12%) |
96.30 |
96.30 - 96.90 |
0.2562 times |
Mon 20 October 2025 |
96.38 (-0.64%) |
97.75 |
96.33 - 97.75 |
0.1357 times |
Fri 17 October 2025 |
97.00 (0.52%) |
96.85 |
96.65 - 97.10 |
8.2183 times |
Thu 16 October 2025 |
96.50 (-0.62%) |
96.50 |
96.50 - 96.70 |
0.1261 times |
Wed 15 October 2025 |
97.10 (0.42%) |
97.05 |
97.05 - 97.10 |
0.9209 times |
Tue 14 October 2025 |
96.69 (0.67%) |
93.64 |
93.64 - 96.70 |
0.1884 times |
Mon 13 October 2025 |
96.05 (0.26%) |
93.40 |
93.40 - 96.50 |
0.0025 times |
Fri 10 October 2025 |
95.80 (-0.26%) |
96.00 |
95.80 - 96.20 |
0.0233 times |
Weekly price and charts GoiLoan Strong weekly Stock price targets for GoiLoan 667GS2050_GS are 95.95 and 96.39 | Weekly Target 1 | 95.84 | | Weekly Target 2 | 96.06 | | Weekly Target 3 | 96.28 | | Weekly Target 4 | 96.5 | | Weekly Target 5 | 96.72 |
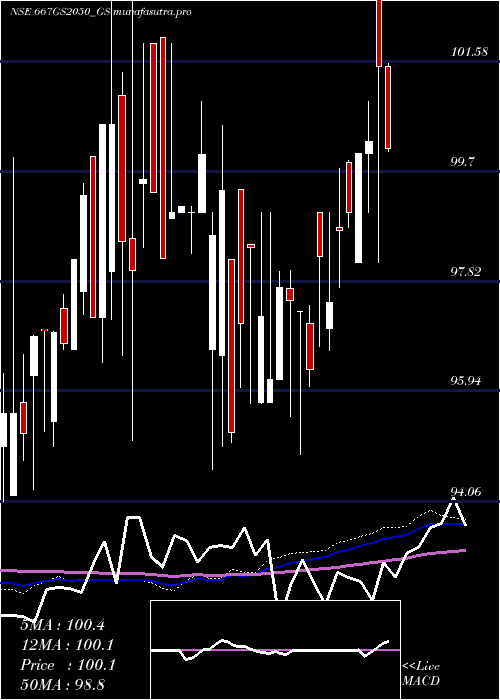
Weekly price and volumes for Goi Loan
| Date |
Closing |
Open |
Range |
Volume |
Tue 28 October 2025 |
96.28 (-0.64%) |
96.50 |
96.06 - 96.50 |
0.0283 times |
Fri 24 October 2025 |
96.90 (-0.1%) |
97.75 |
96.30 - 97.75 |
0.3057 times |
Fri 17 October 2025 |
97.00 (1.25%) |
93.40 |
93.40 - 97.10 |
5.8083 times |
Fri 10 October 2025 |
95.80 (0.42%) |
96.20 |
95.70 - 96.35 |
0.31 times |
Fri 03 October 2025 |
95.40 (0.21%) |
95.30 |
95.00 - 97.00 |
0.5375 times |
Fri 26 September 2025 |
95.20 (-2.86%) |
98.00 |
94.61 - 98.50 |
2.9654 times |
Fri 19 September 2025 |
98.00 (0.51%) |
96.00 |
96.00 - 98.00 |
0.0144 times |
Fri 12 September 2025 |
97.50 (-1.52%) |
97.50 |
97.50 - 97.70 |
0.013 times |
Fri 05 September 2025 |
99.00 (0.51%) |
98.00 |
97.99 - 99.00 |
0.0065 times |
Fri 29 August 2025 |
98.50 (0.51%) |
99.90 |
98.25 - 99.90 |
0.0107 times |
Thu 21 August 2025 |
98.00 (-1.61%) |
98.00 |
98.00 - 98.00 |
0.6743 times |
Monthly price and charts GoiLoan Strong monthly Stock price targets for GoiLoan 667GS2050_GS are 94.84 and 99.19 | Monthly Target 1 | 91.46 | | Monthly Target 2 | 93.87 | | Monthly Target 3 | 95.81 | | Monthly Target 4 | 98.22 | | Monthly Target 5 | 100.16 |
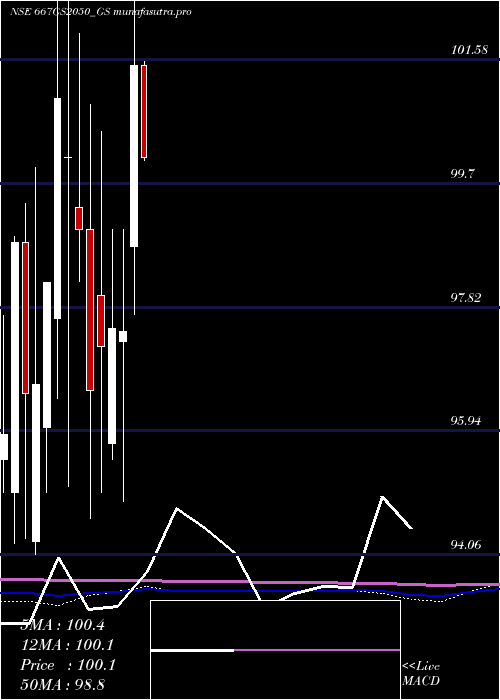
Monthly price and volumes Goi Loan
| Date |
Closing |
Open |
Range |
Volume |
Tue 28 October 2025 |
96.28 (0.83%) |
95.80 |
93.40 - 97.75 |
3.9505 times |
Tue 30 September 2025 |
95.49 (-3.06%) |
98.00 |
94.61 - 99.00 |
2.0748 times |
Fri 29 August 2025 |
98.50 (-1.01%) |
99.60 |
96.21 - 99.90 |
0.6171 times |
Thu 31 July 2025 |
99.50 (0.71%) |
98.99 |
95.78 - 99.50 |
0.4375 times |
Mon 30 June 2025 |
98.80 (-1.2%) |
100.65 |
97.50 - 101.99 |
0.477 times |
Thu 29 May 2025 |
100.00 (-1.48%) |
101.50 |
99.75 - 103.75 |
0.2025 times |
Wed 30 April 2025 |
101.50 (4.15%) |
98.74 |
97.71 - 102.71 |
0.6678 times |
Fri 28 March 2025 |
97.46 (-0.04%) |
97.30 |
94.86 - 99.00 |
0.3828 times |
Thu 27 February 2025 |
97.50 (0.29%) |
95.74 |
95.50 - 99.00 |
0.7028 times |
Fri 31 January 2025 |
97.22 (0.69%) |
98.00 |
95.00 - 100.49 |
0.4874 times |
Tue 24 December 2024 |
96.55 (-2.47%) |
99.00 |
94.60 - 100.90 |
0.4976 times |
DMA SMA EMA moving averages of Goi Loan 667GS2050_GS
DMA (daily moving average) of Goi Loan 667GS2050_GS
| DMA period | DMA value | | 5 day DMA | 96.51 | | 12 day DMA | 96.48 | | 20 day DMA | 96.12 | | 35 day DMA | 96.9 | | 50 day DMA | 97.34 | | 100 day DMA | 98.5 | | 150 day DMA | 98.17 | | 200 day DMA | 98.39 | EMA (exponential moving average) of Goi Loan 667GS2050_GS
| EMA period | EMA current | EMA prev | EMA prev2 | | 5 day EMA | 96.5 | 96.61 | 96.67 | | 12 day EMA | 96.49 | 96.53 | 96.54 | | 20 day EMA | 96.54 | 96.57 | 96.58 | | 35 day EMA | 96.85 | 96.88 | 96.9 | | 50 day EMA | 97.28 | 97.32 | 97.35 |
SMA (simple moving average) of Goi Loan 667GS2050_GS
| SMA period | SMA current | SMA prev | SMA prev2 | | 5 day SMA | 96.51 | 96.66 | 96.66 | | 12 day SMA | 96.48 | 96.48 | 96.46 | | 20 day SMA | 96.12 | 96.07 | 96.17 | | 35 day SMA | 96.9 | 96.95 | 97.04 | | 50 day SMA | 97.34 | 97.37 | 97.4 | | 100 day SMA | 98.5 | 98.52 | 98.55 | | 150 day SMA | 98.17 | 98.19 | 98.19 | | 200 day SMA | 98.39 | 98.4 | 98.41 |
|
|
