GoiLoan 648GS2035_GS full analysis,charts,indicators,moving averages,SMA,DMA,EMA,ADX,MACD,RSIGoi Loan 648GS2035_GS WideScreen charts, DMA,SMA,EMA technical analysis, forecast prediction, by indicators ADX,MACD,RSI,CCI NSE stock exchange
Daily price and charts and targets GoiLoan Strong Daily Stock price targets for GoiLoan 648GS2035_GS are 99.5 and 99.5 | Daily Target 1 | 99.5 | | Daily Target 2 | 99.5 | | Daily Target 3 | 99.5 | | Daily Target 4 | 99.5 | | Daily Target 5 | 99.5 |
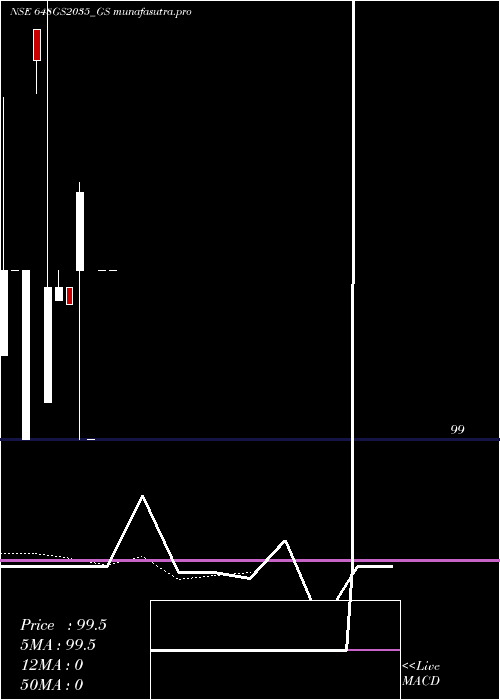
Daily price and volume Goi Loan
| Date |
Closing |
Open |
Range |
Volume |
Tue 28 October 2025 |
99.50 (0%) |
99.50 |
99.50 - 99.50 |
0.318 times |
Fri 24 October 2025 |
99.50 (0.51%) |
99.50 |
99.50 - 99.50 |
0.0707 times |
Tue 21 October 2025 |
99.00 (-0.72%) |
99.00 |
99.00 - 99.00 |
0.2826 times |
Mon 20 October 2025 |
99.72 (0.32%) |
99.50 |
99.00 - 99.75 |
0.8125 times |
Fri 17 October 2025 |
99.40 (-0.05%) |
99.45 |
99.40 - 99.45 |
0.0346 times |
Thu 16 October 2025 |
99.45 (0%) |
99.41 |
99.41 - 99.50 |
1.0598 times |
Wed 15 October 2025 |
99.45 (-0.66%) |
99.11 |
99.11 - 100.74 |
1.1687 times |
Tue 14 October 2025 |
100.11 (0.61%) |
100.20 |
100.01 - 100.20 |
0.9185 times |
Mon 13 October 2025 |
99.50 (0%) |
99.00 |
99.00 - 99.50 |
4.2041 times |
Fri 10 October 2025 |
99.50 (0%) |
99.50 |
99.50 - 99.50 |
1.1305 times |
Thu 09 October 2025 |
99.50 (0%) |
99.25 |
99.25 - 100.00 |
0.2826 times |
Weekly price and charts GoiLoan Strong weekly Stock price targets for GoiLoan 648GS2035_GS are 99.5 and 99.5 | Weekly Target 1 | 99.5 | | Weekly Target 2 | 99.5 | | Weekly Target 3 | 99.5 | | Weekly Target 4 | 99.5 | | Weekly Target 5 | 99.5 |
Weekly price and volumes for Goi Loan
| Date |
Closing |
Open |
Range |
Volume |
Tue 28 October 2025 |
99.50 (0%) |
99.50 |
99.50 - 99.50 |
0.1075 times |
Fri 24 October 2025 |
99.50 (0.1%) |
99.50 |
99.00 - 99.75 |
0.3943 times |
Fri 17 October 2025 |
99.40 (0%) |
99.00 |
99.00 - 100.74 |
2.4981 times |
Wed 29 October 2025 |
(0%) |
|
- |
0 times |

Monthly price and charts GoiLoan Strong monthly Stock price targets for GoiLoan 648GS2035_GS are 99.25 and 100.99 | Monthly Target 1 | 98.01 | | Monthly Target 2 | 98.75 | | Monthly Target 3 | 99.746666666667 | | Monthly Target 4 | 100.49 | | Monthly Target 5 | 101.49 |
Monthly price and volumes Goi Loan
| Date |
Closing |
Open |
Range |
Volume |
Tue 28 October 2025 |
99.50 (0%) |
99.25 |
99.00 - 100.74 |
1 times |
Wed 29 October 2025 |
(0%) |
|
- |
0 times |

DMA SMA EMA moving averages of Goi Loan 648GS2035_GS
DMA (daily moving average) of Goi Loan 648GS2035_GS
| DMA period | DMA value | | 5 day DMA | 99.42 | | 12 day DMA | | | 20 day DMA | | | 35 day DMA | | | 50 day DMA | | | 100 day DMA | | | 150 day DMA | | | 200 day DMA | | EMA (exponential moving average) of Goi Loan 648GS2035_GS
| EMA period | EMA current | EMA prev | EMA prev2 | | 5 day EMA | 99.45 | 99.43 | 99.39 | | 12 day EMA | 0 | 0 | 0 | | 20 day EMA | 0 | 0 | 0 | | 35 day EMA | 0 | 0 | 0 | | 50 day EMA | 0 | 0 | 0 |
SMA (simple moving average) of Goi Loan 648GS2035_GS
| SMA period | SMA current | SMA prev | SMA prev2 | | 5 day SMA | 99.42 | 99.41 | 99.4 | | 12 day SMA | | 20 day SMA | | 35 day SMA | | 50 day SMA | | 100 day SMA | | 150 day SMA | | 200 day SMA |
|
|
