GoiLoan 633GS2035_GS full analysis,charts,indicators,moving averages,SMA,DMA,EMA,ADX,MACD,RSIGoi Loan 633GS2035_GS WideScreen charts, DMA,SMA,EMA technical analysis, forecast prediction, by indicators ADX,MACD,RSI,CCI NSE stock exchange
Daily price and charts and targets GoiLoan Strong Daily Stock price targets for GoiLoan 633GS2035_GS are 101.5 and 101.5 | Daily Target 1 | 101.5 | | Daily Target 2 | 101.5 | | Daily Target 3 | 101.5 | | Daily Target 4 | 101.5 | | Daily Target 5 | 101.5 |
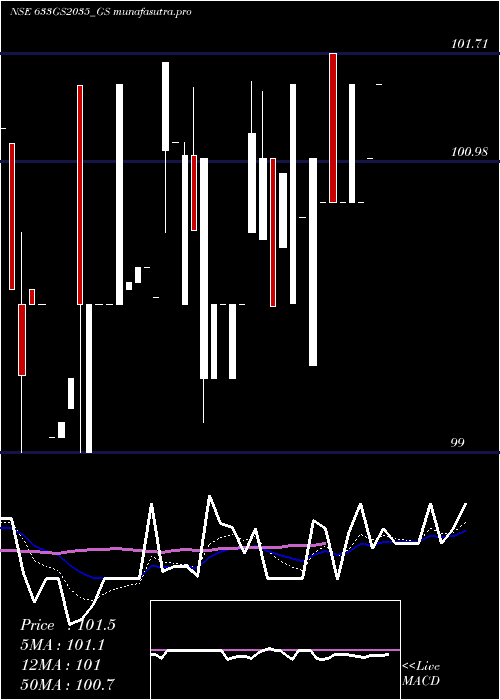
Daily price and volume Goi Loan
| Date |
Closing |
Open |
Range |
Volume |
Wed 29 October 2025 |
101.50 (0.5%) |
101.50 |
101.50 - 101.50 |
0.0043 times |
Tue 28 October 2025 |
101.00 (0.3%) |
101.00 |
101.00 - 101.00 |
0.0118 times |
Mon 27 October 2025 |
100.70 (-0.79%) |
100.70 |
100.70 - 100.70 |
0.1072 times |
Fri 24 October 2025 |
101.50 (0.79%) |
100.70 |
100.70 - 101.50 |
0.537 times |
Thu 23 October 2025 |
100.70 (0%) |
100.70 |
100.70 - 100.70 |
0.3216 times |
Tue 21 October 2025 |
100.70 (0%) |
101.71 |
100.70 - 101.71 |
3.1086 times |
Mon 20 October 2025 |
100.70 (-0.3%) |
100.70 |
100.70 - 100.70 |
0.2144 times |
Fri 17 October 2025 |
101.00 (0.4%) |
99.59 |
99.59 - 101.00 |
3.6553 times |
Thu 16 October 2025 |
100.60 (-0.89%) |
100.60 |
100.60 - 100.60 |
1.5007 times |
Wed 15 October 2025 |
101.50 (0.59%) |
100.01 |
100.01 - 101.50 |
0.5392 times |
Tue 14 October 2025 |
100.90 (0.91%) |
100.40 |
100.40 - 100.90 |
6.11 times |
Weekly price and charts GoiLoan Strong weekly Stock price targets for GoiLoan 633GS2035_GS are 101.1 and 101.9 | Weekly Target 1 | 100.43 | | Weekly Target 2 | 100.97 | | Weekly Target 3 | 101.23333333333 | | Weekly Target 4 | 101.77 | | Weekly Target 5 | 102.03 |
Weekly price and volumes for Goi Loan
| Date |
Closing |
Open |
Range |
Volume |
Wed 29 October 2025 |
101.50 (0%) |
100.70 |
100.70 - 101.50 |
0.0131 times |
Fri 24 October 2025 |
101.50 (0.5%) |
100.70 |
100.70 - 101.71 |
0.4456 times |
Fri 17 October 2025 |
101.00 (0%) |
101.00 |
99.59 - 101.50 |
1.2811 times |
Fri 10 October 2025 |
101.00 (1%) |
99.50 |
99.50 - 101.52 |
3.4493 times |
Fri 03 October 2025 |
100.00 (-0.51%) |
99.50 |
99.20 - 101.00 |
1.028 times |
Fri 26 September 2025 |
100.51 (0.26%) |
100.05 |
100.00 - 101.65 |
0.3554 times |
Fri 19 September 2025 |
100.25 (0.25%) |
100.00 |
100.00 - 101.50 |
0.3427 times |
Thu 11 September 2025 |
100.00 (0.5%) |
101.49 |
99.00 - 101.49 |
1.2795 times |
Fri 05 September 2025 |
99.50 (-0.5%) |
100.00 |
99.10 - 100.00 |
0.5826 times |
Fri 29 August 2025 |
100.00 (-1.23%) |
101.20 |
99.00 - 101.20 |
1.2226 times |
Wed 13 August 2025 |
101.25 (0.22%) |
101.10 |
100.50 - 101.25 |
0.3082 times |
Monthly price and charts GoiLoan Strong monthly Stock price targets for GoiLoan 633GS2035_GS are 100.5 and 102.71 | Monthly Target 1 | 98.69 | | Monthly Target 2 | 100.1 | | Monthly Target 3 | 100.90333333333 | | Monthly Target 4 | 102.31 | | Monthly Target 5 | 103.11 |
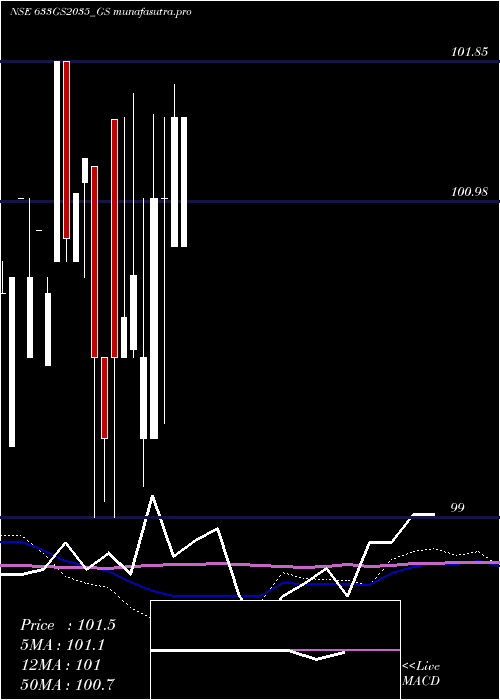
Monthly price and volumes Goi Loan
| Date |
Closing |
Open |
Range |
Volume |
Wed 29 October 2025 |
101.50 (1.5%) |
100.00 |
99.50 - 101.71 |
1.5642 times |
Tue 30 September 2025 |
100.00 (0%) |
100.00 |
99.00 - 101.65 |
1.07 times |
Fri 29 August 2025 |
100.00 (-0.6%) |
100.80 |
99.00 - 101.25 |
0.4971 times |
Thu 31 July 2025 |
100.60 (-0.4%) |
100.50 |
99.95 - 101.85 |
0.2366 times |
Mon 30 June 2025 |
101.00 (-0.79%) |
100.40 |
99.45 - 101.80 |
0.1224 times |
Thu 29 May 2025 |
101.80 (0%) |
98.75 |
98.75 - 101.80 |
2.5097 times |
Thu 30 October 2025 |
(0%) |
|
- |
0 times |

DMA SMA EMA moving averages of Goi Loan 633GS2035_GS
DMA (daily moving average) of Goi Loan 633GS2035_GS
| DMA period | DMA value | | 5 day DMA | 101.08 | | 12 day DMA | 100.9 | | 20 day DMA | 100.72 | | 35 day DMA | 100.52 | | 50 day DMA | 100.57 | | 100 day DMA | | | 150 day DMA | | | 200 day DMA | | EMA (exponential moving average) of Goi Loan 633GS2035_GS
| EMA period | EMA current | EMA prev | EMA prev2 | | 5 day EMA | 101.12 | 100.93 | 100.9 | | 12 day EMA | 100.95 | 100.85 | 100.82 | | 20 day EMA | 100.83 | 100.76 | 100.73 | | 35 day EMA | 100.73 | 100.68 | 100.66 | | 50 day EMA | 100.64 | 100.61 | 100.59 |
SMA (simple moving average) of Goi Loan 633GS2035_GS
| SMA period | SMA current | SMA prev | SMA prev2 | | 5 day SMA | 101.08 | 100.92 | 100.86 | | 12 day SMA | 100.9 | 100.86 | 100.87 | | 20 day SMA | 100.72 | 100.7 | 100.71 | | 35 day SMA | 100.52 | 100.48 | 100.45 | | 50 day SMA | 100.57 | 100.58 | 100.57 | | 100 day SMA | | 150 day SMA | | 200 day SMA |
|
|
