GoiLoan 610GS2031_GS full analysis,charts,indicators,moving averages,SMA,DMA,EMA,ADX,MACD,RSIGoi Loan 610GS2031_GS WideScreen charts, DMA,SMA,EMA technical analysis, forecast prediction, by indicators ADX,MACD,RSI,CCI NSE stock exchange
Daily price and charts and targets GoiLoan Strong Daily Stock price targets for GoiLoan 610GS2031_GS are 101.3 and 101.3 | Daily Target 1 | 101.3 | | Daily Target 2 | 101.3 | | Daily Target 3 | 101.3 | | Daily Target 4 | 101.3 | | Daily Target 5 | 101.3 |
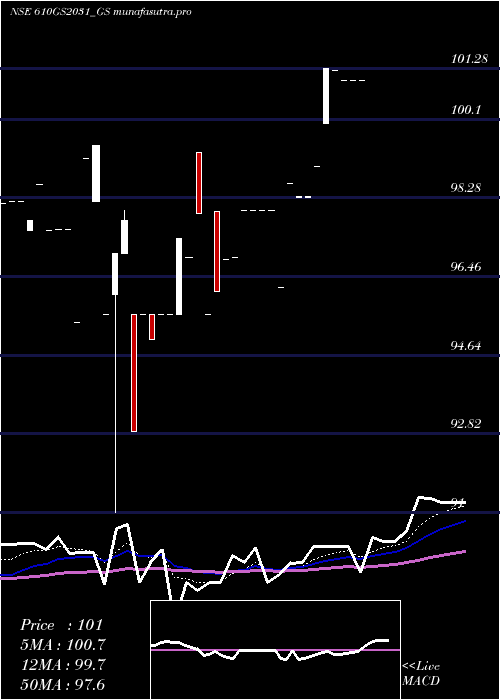
Daily price and volume Goi Loan
| Date |
Closing |
Open |
Range |
Volume |
Tue 09 December 2025 |
101.30 (0.8%) |
101.30 |
101.30 - 101.30 |
0.0009 times |
Wed 03 December 2025 |
100.50 (0.09%) |
100.30 |
100.30 - 100.50 |
0.744 times |
Mon 01 December 2025 |
100.41 (0.91%) |
98.84 |
98.84 - 100.50 |
1.0249 times |
Thu 27 November 2025 |
99.50 (0%) |
99.50 |
99.50 - 99.50 |
0.093 times |
Tue 25 November 2025 |
99.50 (1.69%) |
99.50 |
99.50 - 99.50 |
2.4647 times |
Mon 24 November 2025 |
97.85 (-0.15%) |
97.85 |
97.85 - 97.85 |
0.9301 times |
Tue 18 November 2025 |
98.00 (0%) |
98.00 |
98.00 - 98.00 |
1.1151 times |
Mon 17 November 2025 |
98.00 (0.05%) |
98.00 |
98.00 - 98.00 |
0.186 times |
Fri 14 November 2025 |
97.95 (-2.34%) |
97.85 |
97.85 - 97.95 |
0.186 times |
Wed 12 November 2025 |
100.30 (4.47%) |
97.85 |
97.85 - 100.30 |
3.2552 times |
Tue 04 November 2025 |
96.01 (-3.7%) |
97.20 |
96.01 - 101.25 |
0.0028 times |
Weekly price and charts GoiLoan Strong weekly Stock price targets for GoiLoan 610GS2031_GS are 101.3 and 101.3 | Weekly Target 1 | 101.3 | | Weekly Target 2 | 101.3 | | Weekly Target 3 | 101.3 | | Weekly Target 4 | 101.3 | | Weekly Target 5 | 101.3 |
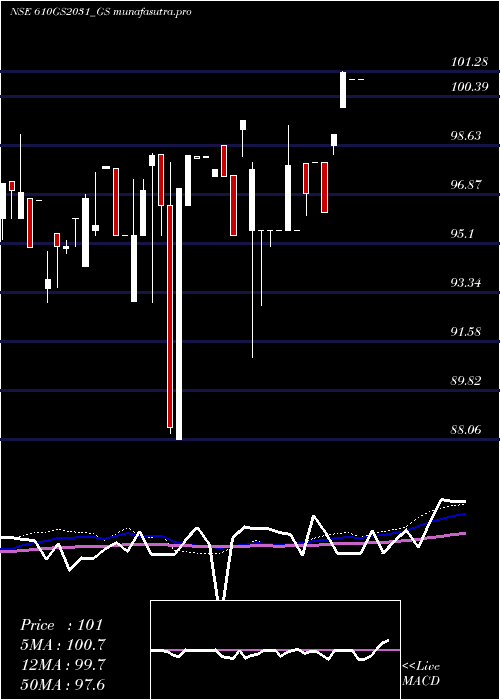
Weekly price and volumes for Goi Loan
| Date |
Closing |
Open |
Range |
Volume |
Tue 09 December 2025 |
101.30 (0.8%) |
101.30 |
101.30 - 101.30 |
0.0007 times |
Wed 03 December 2025 |
100.50 (1.01%) |
98.84 |
98.84 - 100.50 |
1.4002 times |
Thu 27 November 2025 |
99.50 (1.53%) |
97.85 |
97.85 - 99.50 |
2.7606 times |
Tue 18 November 2025 |
98.00 (0.05%) |
98.00 |
98.00 - 98.00 |
1.0299 times |
Fri 14 November 2025 |
97.95 (-1.76%) |
99.60 |
96.01 - 101.25 |
3.2531 times |
Mon 27 October 2025 |
99.70 (0%) |
99.70 |
99.70 - 99.70 |
0.0022 times |
Mon 20 October 2025 |
99.70 (0%) |
99.70 |
99.70 - 99.70 |
0.0007 times |
Thu 16 October 2025 |
99.70 (1.89%) |
99.60 |
99.00 - 99.70 |
0.4071 times |
Fri 10 October 2025 |
97.85 (-1.86%) |
99.60 |
97.85 - 99.60 |
0.2613 times |
Wed 01 October 2025 |
99.70 (0.01%) |
99.65 |
99.65 - 99.70 |
0.8841 times |
Fri 26 September 2025 |
99.69 (2.51%) |
97.25 |
97.25 - 99.70 |
1.9398 times |
Monthly price and charts GoiLoan Strong monthly Stock price targets for GoiLoan 610GS2031_GS are 100.07 and 102.53 | Monthly Target 1 | 98.02 | | Monthly Target 2 | 99.66 | | Monthly Target 3 | 100.48 | | Monthly Target 4 | 102.12 | | Monthly Target 5 | 102.94 |
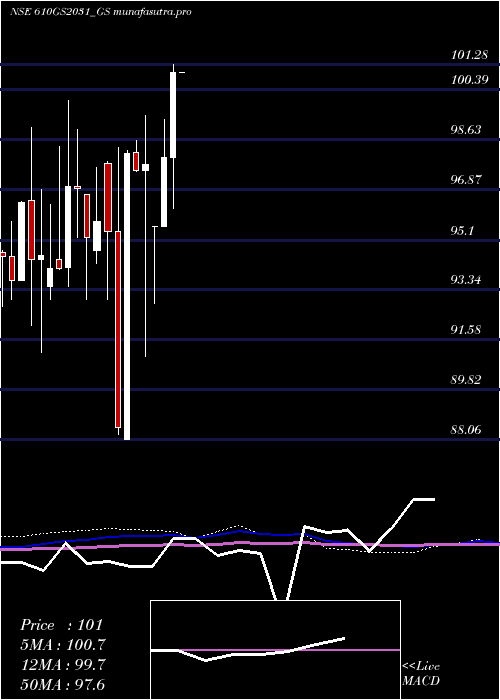
Monthly price and volumes Goi Loan
| Date |
Closing |
Open |
Range |
Volume |
Tue 09 December 2025 |
101.30 (1.81%) |
98.84 |
98.84 - 101.30 |
0.2248 times |
Thu 27 November 2025 |
99.50 (-0.2%) |
99.60 |
96.01 - 101.25 |
1.1305 times |
Mon 27 October 2025 |
99.70 (0%) |
99.70 |
97.85 - 99.70 |
0.2259 times |
Tue 30 September 2025 |
99.70 (1.12%) |
97.25 |
97.25 - 99.70 |
0.4567 times |
Thu 28 August 2025 |
98.60 (-0.89%) |
99.50 |
97.00 - 99.50 |
0.6664 times |
Wed 30 July 2025 |
99.49 (-0.51%) |
101.50 |
97.35 - 101.50 |
2.1943 times |
Mon 30 June 2025 |
100.00 (-0.99%) |
100.00 |
97.50 - 101.50 |
0.3638 times |
Mon 26 May 2025 |
101.00 (0%) |
101.00 |
101.00 - 101.00 |
0.0083 times |
Wed 30 April 2025 |
101.00 (3.06%) |
98.00 |
96.20 - 101.28 |
0.9464 times |
Fri 28 March 2025 |
98.00 (2.53%) |
95.58 |
95.58 - 99.34 |
3.7831 times |
Tue 25 February 2025 |
95.58 (-2.22%) |
95.58 |
92.87 - 95.58 |
0.0141 times |
DMA SMA EMA moving averages of Goi Loan 610GS2031_GS
DMA (daily moving average) of Goi Loan 610GS2031_GS
| DMA period | DMA value | | 5 day DMA | 100.24 | | 12 day DMA | 99.09 | | 20 day DMA | 99.12 | | 35 day DMA | 98.72 | | 50 day DMA | 99.01 | | 100 day DMA | 98.64 | | 150 day DMA | 97.67 | | 200 day DMA | 97.27 | EMA (exponential moving average) of Goi Loan 610GS2031_GS
| EMA period | EMA current | EMA prev | EMA prev2 | | 5 day EMA | 100.28 | 99.77 | 99.4 | | 12 day EMA | 99.56 | 99.24 | 99.01 | | 20 day EMA | 99.29 | 99.08 | 98.93 | | 35 day EMA | 99.22 | 99.1 | 99.02 | | 50 day EMA | 99.29 | 99.21 | 99.16 |
SMA (simple moving average) of Goi Loan 610GS2031_GS
| SMA period | SMA current | SMA prev | SMA prev2 | | 5 day SMA | 100.24 | 99.55 | 99.05 | | 12 day SMA | 99.09 | 98.95 | 98.89 | | 20 day SMA | 99.12 | 99.04 | 99 | | 35 day SMA | 98.72 | 98.67 | 98.64 | | 50 day SMA | 99.01 | 98.98 | 98.97 | | 100 day SMA | 98.64 | 98.61 | 98.58 | | 150 day SMA | 97.67 | 97.62 | 97.57 | | 200 day SMA | 97.27 | 97.23 | 97.2 |
|
|
