GoiLoan 601GS2030_GS full analysis,charts,indicators,moving averages,SMA,DMA,EMA,ADX,MACD,RSIGoi Loan 601GS2030_GS WideScreen charts, DMA,SMA,EMA technical analysis, forecast prediction, by indicators ADX,MACD,RSI,CCI NSE stock exchange
Daily price and charts and targets GoiLoan Strong Daily Stock price targets for GoiLoan 601GS2030_GS are 99.75 and 100.25 | Daily Target 1 | 99.33 | | Daily Target 2 | 99.67 | | Daily Target 3 | 99.833333333333 | | Daily Target 4 | 100.17 | | Daily Target 5 | 100.33 |
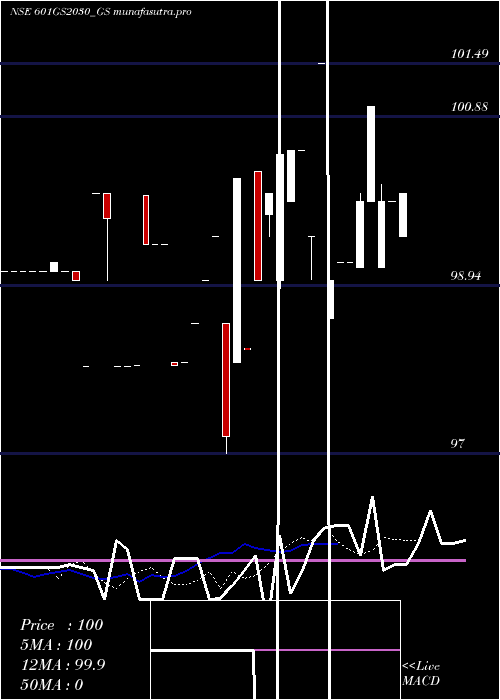
Daily price and volume Goi Loan
| Date |
Closing |
Open |
Range |
Volume |
Wed 29 October 2025 |
100.00 (0.1%) |
99.50 |
99.50 - 100.00 |
2.7267 times |
Tue 28 October 2025 |
99.90 (0%) |
99.90 |
99.90 - 99.90 |
2.2722 times |
Mon 27 October 2025 |
99.90 (-1.09%) |
99.15 |
99.15 - 100.10 |
0.9089 times |
Fri 24 October 2025 |
101.00 (1.1%) |
99.90 |
99.90 - 101.00 |
0.6839 times |
Thu 23 October 2025 |
99.90 (0.71%) |
99.15 |
99.15 - 100.00 |
1.8178 times |
Tue 21 October 2025 |
99.20 (0%) |
99.20 |
99.20 - 99.20 |
0.2272 times |
Mon 20 October 2025 |
99.20 (0.2%) |
99.20 |
99.20 - 99.20 |
0.2272 times |
Fri 17 October 2025 |
99.00 (-2.45%) |
98.55 |
98.55 - 99.00 |
0.2272 times |
Thu 16 October 2025 |
101.49 (2%) |
101.49 |
101.49 - 101.49 |
0.2272 times |
Thu 09 October 2025 |
99.50 (-1%) |
99.50 |
99.01 - 99.50 |
0.6817 times |
Wed 08 October 2025 |
100.50 (0%) |
100.50 |
100.50 - 100.50 |
0.4544 times |
Weekly price and charts GoiLoan Strong weekly Stock price targets for GoiLoan 601GS2030_GS are 99.58 and 100.53 | Weekly Target 1 | 98.8 | | Weekly Target 2 | 99.4 | | Weekly Target 3 | 99.75 | | Weekly Target 4 | 100.35 | | Weekly Target 5 | 100.7 |
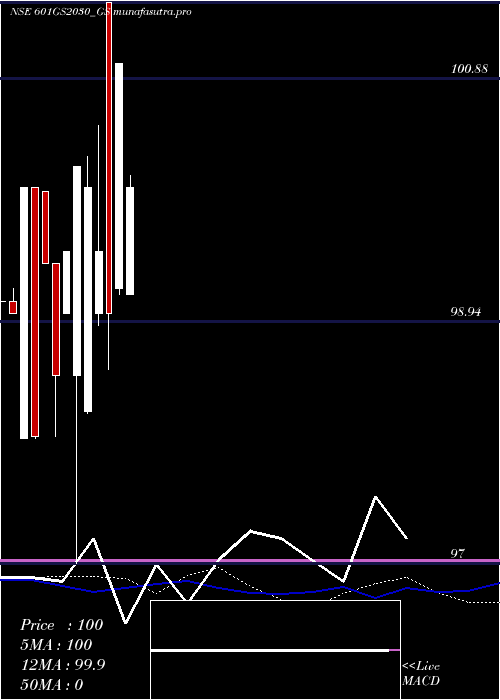
Weekly price and volumes for Goi Loan
| Date |
Closing |
Open |
Range |
Volume |
Wed 29 October 2025 |
100.00 (-0.99%) |
99.15 |
99.15 - 100.10 |
0.0086 times |
Fri 24 October 2025 |
101.00 (2.02%) |
99.20 |
99.15 - 101.00 |
0.0043 times |
Fri 17 October 2025 |
99.00 (-0.5%) |
101.49 |
98.55 - 101.49 |
0.0007 times |
Thu 09 October 2025 |
99.50 (-0.5%) |
99.00 |
98.90 - 100.50 |
0.0074 times |
Fri 03 October 2025 |
100.00 (-0.17%) |
98.21 |
98.20 - 100.25 |
0.0054 times |
Thu 18 September 2025 |
100.17 (0.67%) |
98.50 |
97.00 - 100.17 |
9.9646 times |
Fri 12 September 2025 |
99.50 (1.02%) |
99.00 |
99.00 - 99.50 |
0.0015 times |
Fri 05 September 2025 |
98.50 (-0.91%) |
99.40 |
98.01 - 99.40 |
0.0048 times |
Thu 28 August 2025 |
99.40 (1.42%) |
99.97 |
99.40 - 99.97 |
0.0001 times |
Thu 21 August 2025 |
98.01 (-1.99%) |
100.00 |
98.00 - 100.00 |
0.0027 times |
Wed 13 August 2025 |
100.00 (1.01%) |
98.00 |
98.00 - 100.00 |
0.004 times |
Monthly price and charts GoiLoan Strong monthly Stock price targets for GoiLoan 601GS2030_GS are 97.81 and 100.75 | Monthly Target 1 | 97.07 | | Monthly Target 2 | 98.54 | | Monthly Target 3 | 100.01333333333 | | Monthly Target 4 | 101.48 | | Monthly Target 5 | 102.95 |
Monthly price and volumes Goi Loan
| Date |
Closing |
Open |
Range |
Volume |
Wed 29 October 2025 |
100.00 (1.83%) |
100.25 |
98.55 - 101.49 |
0.0102 times |
Tue 23 September 2025 |
98.20 (-1.21%) |
99.40 |
97.00 - 100.17 |
3.9642 times |
Thu 28 August 2025 |
99.40 (0.3%) |
99.10 |
98.00 - 100.00 |
0.0243 times |
Wed 30 July 2025 |
99.10 (0%) |
99.10 |
99.10 - 99.10 |
0.0013 times |
Thu 30 October 2025 |
(0%) |
|
- |
0 times |

DMA SMA EMA moving averages of Goi Loan 601GS2030_GS
DMA (daily moving average) of Goi Loan 601GS2030_GS
| DMA period | DMA value | | 5 day DMA | 100.14 | | 12 day DMA | 100.01 | | 20 day DMA | 99.68 | | 35 day DMA | 99.3 | | 50 day DMA | | | 100 day DMA | | | 150 day DMA | | | 200 day DMA | | EMA (exponential moving average) of Goi Loan 601GS2030_GS
| EMA period | EMA current | EMA prev | EMA prev2 | | 5 day EMA | 99.99 | 99.99 | 100.04 | | 12 day EMA | 99.88 | 99.86 | 99.85 | | 20 day EMA | 99.71 | 99.68 | 99.66 | | 35 day EMA | 99.39 | 99.35 | 99.32 | | 50 day EMA | 0 | 0 | 0 |
SMA (simple moving average) of Goi Loan 601GS2030_GS
| SMA period | SMA current | SMA prev | SMA prev2 | | 5 day SMA | 100.14 | 99.98 | 99.84 | | 12 day SMA | 100.01 | 100.05 | 100.05 | | 20 day SMA | 99.68 | 99.61 | 99.51 | | 35 day SMA | 99.3 | 99.27 | 99.25 | | 50 day SMA | | 100 day SMA | | 150 day SMA | | 200 day SMA |
|
|
