GoiLoan 563GS2026_GS full analysis,charts,indicators,moving averages,SMA,DMA,EMA,ADX,MACD,RSIGoi Loan 563GS2026_GS WideScreen charts, DMA,SMA,EMA technical analysis, forecast prediction, by indicators ADX,MACD,RSI,CCI NSE stock exchange
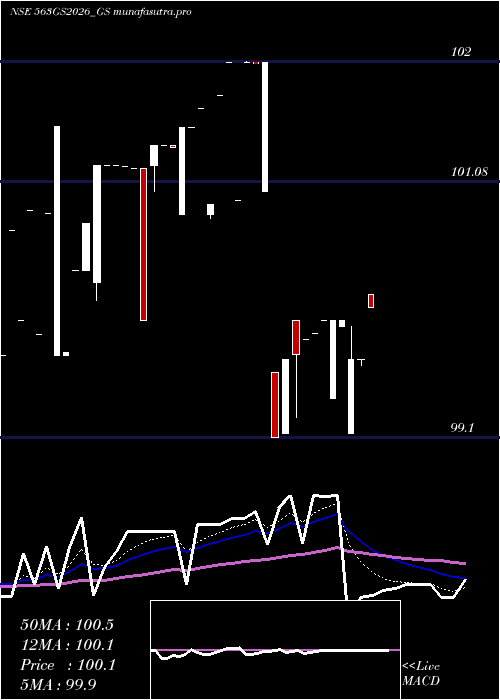
Daily price and charts and targets GoiLoan Strong Daily Stock price targets for GoiLoan 563GS2026_GS are 100.1 and 100.3 | Daily Target 1 | 99.93 | | Daily Target 2 | 100.07 | | Daily Target 3 | 100.13333333333 | | Daily Target 4 | 100.27 | | Daily Target 5 | 100.33 |
Daily price and volume Goi Loan
| Date |
Closing |
Open |
Range |
Volume |
Fri 24 October 2025 |
100.20 (0%) |
100.00 |
100.00 - 100.20 |
1.2558 times |
Thu 23 October 2025 |
100.20 (0.64%) |
99.55 |
99.55 - 100.20 |
5.1748 times |
Mon 20 October 2025 |
99.56 (-1.42%) |
99.55 |
99.55 - 99.56 |
0.0121 times |
Fri 17 October 2025 |
100.99 (0.99%) |
97.50 |
97.50 - 100.99 |
3.0159 times |
Thu 16 October 2025 |
100.00 (0.52%) |
99.50 |
99.50 - 100.00 |
0.5144 times |
Tue 14 October 2025 |
99.48 (0.05%) |
99.50 |
99.48 - 99.50 |
0.002 times |
Fri 10 October 2025 |
99.43 (-3.47%) |
99.50 |
99.43 - 99.50 |
0.01 times |
Thu 09 October 2025 |
103.00 (0%) |
103.00 |
102.18 - 103.00 |
0.006 times |
Wed 08 October 2025 |
103.00 (0.82%) |
103.00 |
103.00 - 103.00 |
0.003 times |
Tue 07 October 2025 |
102.16 (0.34%) |
102.16 |
102.16 - 102.16 |
0.006 times |
Mon 29 September 2025 |
101.81 (0.09%) |
99.17 |
99.17 - 101.81 |
0.0271 times |
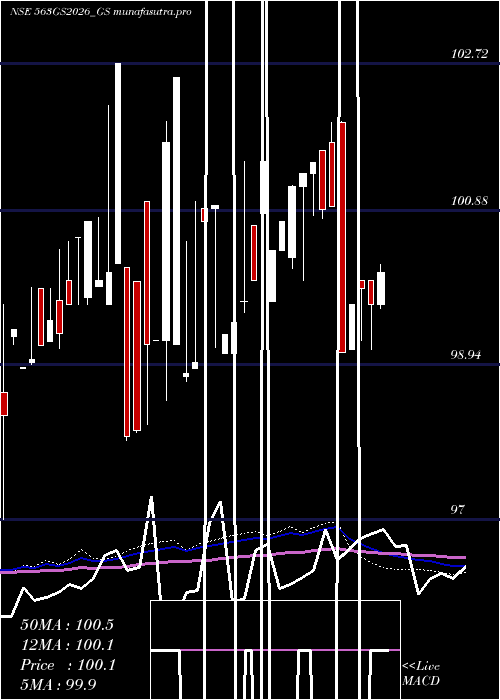
Weekly price and charts GoiLoan Strong weekly Stock price targets for GoiLoan 563GS2026_GS are 99.88 and 100.53 | Weekly Target 1 | 99.33 | | Weekly Target 2 | 99.77 | | Weekly Target 3 | 99.983333333333 | | Weekly Target 4 | 100.42 | | Weekly Target 5 | 100.63 |
Weekly price and volumes for Goi Loan
| Date |
Closing |
Open |
Range |
Volume |
Fri 24 October 2025 |
100.20 (-0.78%) |
99.55 |
99.55 - 100.20 |
3.6774 times |
Fri 17 October 2025 |
100.99 (1.57%) |
99.50 |
97.50 - 100.99 |
2.0162 times |
Fri 10 October 2025 |
99.43 (-2.25%) |
99.17 |
99.17 - 103.00 |
0.0298 times |
Fri 26 September 2025 |
101.72 (-1.24%) |
102.00 |
101.72 - 102.30 |
0.043 times |
Thu 18 September 2025 |
103.00 (0%) |
105.57 |
101.65 - 105.57 |
0.9771 times |
Fri 12 September 2025 |
103.00 (0%) |
100.42 |
100.42 - 103.00 |
0.0046 times |
Fri 05 September 2025 |
103.00 (0.24%) |
101.65 |
101.33 - 103.00 |
0.0029 times |
Fri 29 August 2025 |
102.75 (0.83%) |
101.90 |
101.45 - 102.75 |
1.6738 times |
Fri 22 August 2025 |
101.90 (0%) |
99.35 |
99.35 - 101.90 |
0.6933 times |
Thu 14 August 2025 |
101.90 (1.13%) |
101.00 |
100.89 - 101.90 |
0.8819 times |
Wed 06 August 2025 |
100.76 (-1.69%) |
100.74 |
100.74 - 102.25 |
0.0023 times |
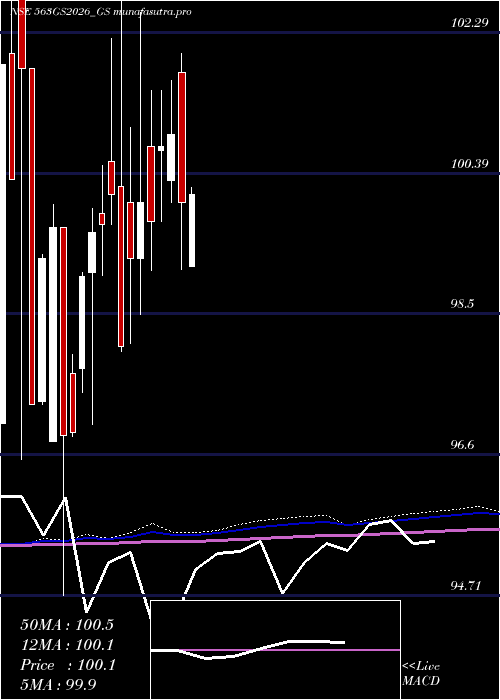
Monthly price and charts GoiLoan Strong monthly Stock price targets for GoiLoan 563GS2026_GS are 96.1 and 101.6 | Monthly Target 1 | 94.73 | | Monthly Target 2 | 97.47 | | Monthly Target 3 | 100.23333333333 | | Monthly Target 4 | 102.97 | | Monthly Target 5 | 105.73 |
Monthly price and volumes Goi Loan
| Date |
Closing |
Open |
Range |
Volume |
Fri 24 October 2025 |
100.20 (-1.58%) |
102.16 |
97.50 - 103.00 |
0.7797 times |
Mon 29 September 2025 |
101.81 (-0.91%) |
101.65 |
99.17 - 105.57 |
0.1425 times |
Fri 29 August 2025 |
102.75 (2.13%) |
102.49 |
99.35 - 102.75 |
0.4442 times |
Tue 29 July 2025 |
100.61 (-1.8%) |
105.00 |
100.61 - 105.00 |
0.438 times |
Fri 27 June 2025 |
102.45 (1.79%) |
100.65 |
99.00 - 105.00 |
1.9099 times |
Fri 30 May 2025 |
100.65 (0.65%) |
99.13 |
97.60 - 102.66 |
0.5113 times |
Wed 30 April 2025 |
100.00 (-0.89%) |
101.74 |
99.10 - 102.00 |
2.449 times |
Fri 28 March 2025 |
100.90 (0.15%) |
100.29 |
100.00 - 101.64 |
0.9763 times |
Fri 28 February 2025 |
100.75 (1.02%) |
100.70 |
99.73 - 101.50 |
0.2604 times |
Fri 31 January 2025 |
99.73 (-0.27%) |
100.75 |
99.08 - 101.50 |
2.0887 times |
Tue 31 December 2024 |
100.00 (0.76%) |
99.25 |
98.49 - 102.55 |
0.7627 times |
DMA SMA EMA moving averages of Goi Loan 563GS2026_GS
DMA (daily moving average) of Goi Loan 563GS2026_GS
| DMA period | DMA value | | 5 day DMA | 100.19 | | 12 day DMA | 100.96 | | 20 day DMA | 101.45 | | 35 day DMA | 101.54 | | 50 day DMA | 101.49 | | 100 day DMA | 101.08 | | 150 day DMA | 100.74 | | 200 day DMA | 100.43 | EMA (exponential moving average) of Goi Loan 563GS2026_GS
| EMA period | EMA current | EMA prev | EMA prev2 | | 5 day EMA | 100.25 | 100.28 | 100.32 | | 12 day EMA | 100.76 | 100.86 | 100.98 | | 20 day EMA | 101.09 | 101.18 | 101.28 | | 35 day EMA | 101.29 | 101.35 | 101.42 | | 50 day EMA | 101.36 | 101.41 | 101.46 |
SMA (simple moving average) of Goi Loan 563GS2026_GS
| SMA period | SMA current | SMA prev | SMA prev2 | | 5 day SMA | 100.19 | 100.05 | 99.89 | | 12 day SMA | 100.96 | 101.14 | 101.29 | | 20 day SMA | 101.45 | 101.59 | 101.64 | | 35 day SMA | 101.54 | 101.57 | 101.6 | | 50 day SMA | 101.49 | 101.51 | 101.5 | | 100 day SMA | 101.08 | 101.09 | 101.09 | | 150 day SMA | 100.74 | 100.74 | 100.75 | | 200 day SMA | 100.43 | 100.42 | 100.41 |
|
|
