GoiTbill 364D180626_TB full analysis,charts,indicators,moving averages,SMA,DMA,EMA,ADX,MACD,RSIGoi Tbill 364D180626_TB WideScreen charts, DMA,SMA,EMA technical analysis, forecast prediction, by indicators ADX,MACD,RSI,CCI NSE stock exchange
Daily price and charts and targets GoiTbill Strong Daily Stock price targets for GoiTbill 364D180626_TB are 95.89 and 96.12 | Daily Target 1 | 95.69 | | Daily Target 2 | 95.85 | | Daily Target 3 | 95.923333333333 | | Daily Target 4 | 96.08 | | Daily Target 5 | 96.15 |
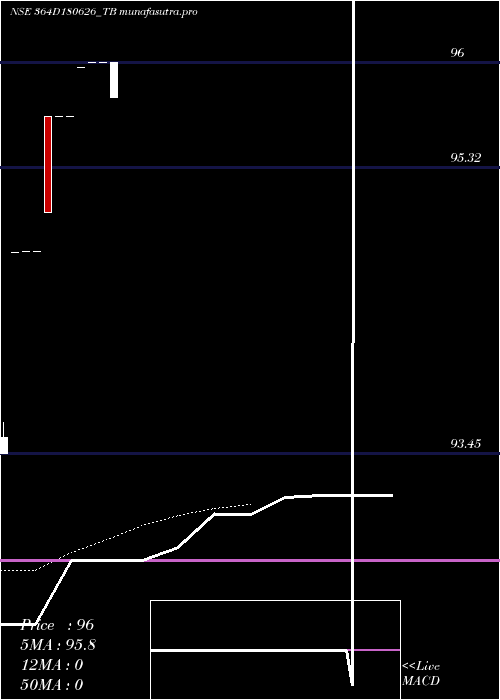
Daily price and volume Goi Tbill
| Date |
Closing |
Open |
Range |
Volume |
Fri 24 October 2025 |
96.00 (0%) |
95.77 |
95.77 - 96.00 |
0.1835 times |
Mon 20 October 2025 |
96.00 (0%) |
96.00 |
96.00 - 96.00 |
0.0917 times |
Thu 16 October 2025 |
96.00 (0.03%) |
96.00 |
96.00 - 96.00 |
0.0917 times |
Mon 13 October 2025 |
95.97 (0.33%) |
95.97 |
95.97 - 95.97 |
0.9174 times |
Thu 25 September 2025 |
95.65 (0%) |
95.65 |
95.65 - 95.65 |
0.2752 times |
Thu 11 September 2025 |
95.65 (0.66%) |
95.65 |
95.65 - 95.65 |
0.0917 times |
Mon 01 September 2025 |
95.02 (0.26%) |
95.65 |
95.02 - 95.65 |
3.945 times |
Thu 21 August 2025 |
94.77 (0%) |
94.77 |
94.77 - 94.77 |
3.6697 times |
Wed 20 August 2025 |
94.77 (0.01%) |
94.77 |
94.77 - 94.77 |
0.1835 times |
Tue 08 July 2025 |
94.76 (1.29%) |
94.76 |
94.76 - 94.76 |
0.5505 times |
Mon 30 June 2025 |
93.55 (0%) |
93.45 |
93.45 - 93.65 |
1.1009 times |
Weekly price and charts GoiTbill Strong weekly Stock price targets for GoiTbill 364D180626_TB are 95.89 and 96.12 | Weekly Target 1 | 95.69 | | Weekly Target 2 | 95.85 | | Weekly Target 3 | 95.923333333333 | | Weekly Target 4 | 96.08 | | Weekly Target 5 | 96.15 |
Weekly price and volumes for Goi Tbill
| Date |
Closing |
Open |
Range |
Volume |
Fri 24 October 2025 |
96.00 (0%) |
96.00 |
95.77 - 96.00 |
0.124 times |
Thu 16 October 2025 |
96.00 (0.37%) |
95.97 |
95.97 - 96.00 |
0.4545 times |
Thu 25 September 2025 |
95.65 (0%) |
95.65 |
95.65 - 95.65 |
0.124 times |
Thu 11 September 2025 |
95.65 (0.93%) |
95.65 |
95.02 - 95.65 |
1.8182 times |
Thu 21 August 2025 |
94.77 (0%) |
93.45 |
93.45 - 94.77 |
2.4793 times |
Tue 28 October 2025 |
(0%) |
|
- |
0 times |

Monthly price and charts GoiTbill Strong monthly Stock price targets for GoiTbill 364D180626_TB are 95.89 and 96.12 | Monthly Target 1 | 95.69 | | Monthly Target 2 | 95.85 | | Monthly Target 3 | 95.923333333333 | | Monthly Target 4 | 96.08 | | Monthly Target 5 | 96.15 |
Monthly price and volumes Goi Tbill
| Date |
Closing |
Open |
Range |
Volume |
Fri 24 October 2025 |
96.00 (0.37%) |
95.97 |
95.77 - 96.00 |
0.5785 times |
Thu 25 September 2025 |
95.65 (0.93%) |
95.65 |
95.02 - 95.65 |
1.9421 times |
Thu 21 August 2025 |
94.77 (0.01%) |
94.77 |
94.77 - 94.77 |
1.7355 times |
Tue 08 July 2025 |
94.76 (1.29%) |
94.76 |
94.76 - 94.76 |
0.2479 times |
Mon 30 June 2025 |
93.55 (0%) |
93.45 |
93.45 - 93.65 |
0.4959 times |
Tue 28 October 2025 |
(0%) |
|
- |
0 times |

DMA SMA EMA moving averages of Goi Tbill 364D180626_TB
DMA (daily moving average) of Goi Tbill 364D180626_TB
| DMA period | DMA value | | 5 day DMA | 95.92 | | 12 day DMA | | | 20 day DMA | | | 35 day DMA | | | 50 day DMA | | | 100 day DMA | | | 150 day DMA | | | 200 day DMA | | EMA (exponential moving average) of Goi Tbill 364D180626_TB
| EMA period | EMA current | EMA prev | EMA prev2 | | 5 day EMA | 95.83 | 95.75 | 95.63 | | 12 day EMA | 0 | 0 | 0 | | 20 day EMA | 0 | 0 | 0 | | 35 day EMA | 0 | 0 | 0 | | 50 day EMA | 0 | 0 | 0 |
SMA (simple moving average) of Goi Tbill 364D180626_TB
| SMA period | SMA current | SMA prev | SMA prev2 | | 5 day SMA | 95.92 | 95.85 | 95.66 | | 12 day SMA | | 20 day SMA | | 35 day SMA | | 50 day SMA | | 100 day SMA | | 150 day SMA | | 200 day SMA |
|
|
