GoiTbill 182D101025_TB full analysis,charts,indicators,moving averages,SMA,DMA,EMA,ADX,MACD,RSIGoi Tbill 182D101025_TB WideScreen charts, DMA,SMA,EMA technical analysis, forecast prediction, by indicators ADX,MACD,RSI,CCI NSE stock exchange
Daily price and charts and targets GoiTbill Strong Daily Stock price targets for GoiTbill 182D101025_TB are 99.31 and 99.49 | Daily Target 1 | 99.16 | | Daily Target 2 | 99.28 | | Daily Target 3 | 99.34 | | Daily Target 4 | 99.46 | | Daily Target 5 | 99.52 |
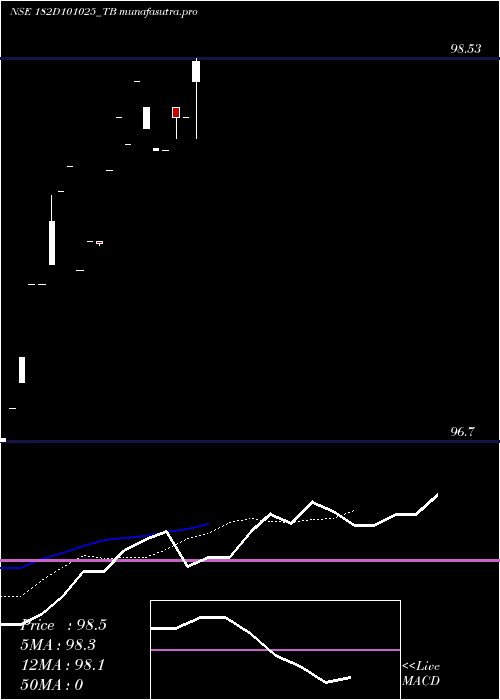
Daily price and volume Goi Tbill
| Date |
Closing |
Open |
Range |
Volume |
Wed 03 September 2025 |
99.40 (0.01%) |
99.22 |
99.22 - 99.40 |
3.0491 times |
Tue 02 September 2025 |
99.39 (0.03%) |
99.36 |
99.36 - 99.39 |
0.2601 times |
Mon 01 September 2025 |
99.36 (0.08%) |
99.36 |
99.36 - 99.36 |
0.0578 times |
Tue 26 August 2025 |
99.28 (-0.01%) |
99.28 |
99.28 - 99.28 |
2.8902 times |
Mon 25 August 2025 |
99.29 (0.08%) |
99.29 |
99.29 - 99.29 |
0.0723 times |
Fri 22 August 2025 |
99.21 (0.41%) |
99.10 |
99.10 - 99.21 |
1.4595 times |
Tue 12 August 2025 |
98.80 (-0.2%) |
98.80 |
98.80 - 98.80 |
0.0145 times |
Mon 11 August 2025 |
99.00 (0.1%) |
99.00 |
99.00 - 99.00 |
1.4451 times |
Fri 08 August 2025 |
98.90 (0.22%) |
98.68 |
98.68 - 98.90 |
0.737 times |
Thu 07 August 2025 |
98.68 (0.02%) |
98.68 |
98.68 - 98.68 |
0.0145 times |
Wed 06 August 2025 |
98.66 (0.1%) |
98.66 |
98.66 - 98.66 |
0.0145 times |
Weekly price and charts GoiTbill Strong weekly Stock price targets for GoiTbill 182D101025_TB are 99.31 and 99.49 | Weekly Target 1 | 99.16 | | Weekly Target 2 | 99.28 | | Weekly Target 3 | 99.34 | | Weekly Target 4 | 99.46 | | Weekly Target 5 | 99.52 |
Weekly price and volumes for Goi Tbill
| Date |
Closing |
Open |
Range |
Volume |
Wed 03 September 2025 |
99.40 (0.12%) |
99.36 |
99.22 - 99.40 |
2.2512 times |
Tue 26 August 2025 |
99.28 (0.07%) |
99.29 |
99.28 - 99.29 |
1.9807 times |
Fri 22 August 2025 |
99.21 (0.31%) |
99.00 |
98.80 - 99.21 |
1.9517 times |
Fri 08 August 2025 |
98.90 (0.39%) |
98.55 |
98.55 - 98.90 |
0.5411 times |
Fri 11 July 2025 |
98.52 (0.44%) |
98.30 |
98.15 - 98.53 |
1.9903 times |
Fri 04 July 2025 |
98.09 (-0.21%) |
98.09 |
98.09 - 98.10 |
0.1159 times |
Wed 25 June 2025 |
98.30 (0.18%) |
98.43 |
98.20 - 98.43 |
0.1449 times |
Thu 19 June 2025 |
98.12 (-0.13%) |
98.12 |
98.12 - 98.12 |
0.0097 times |
Fri 13 June 2025 |
98.25 (0.23%) |
97.52 |
97.52 - 98.25 |
0.5507 times |
Fri 06 June 2025 |
98.02 (0.58%) |
97.45 |
97.45 - 98.02 |
0.4638 times |
Tue 13 May 2025 |
97.45 (0.62%) |
96.98 |
96.98 - 97.45 |
0.0483 times |

Monthly price and charts GoiTbill Strong monthly Stock price targets for GoiTbill 182D101025_TB are 99.31 and 99.49 | Monthly Target 1 | 99.16 | | Monthly Target 2 | 99.28 | | Monthly Target 3 | 99.34 | | Monthly Target 4 | 99.46 | | Monthly Target 5 | 99.52 |
Monthly price and volumes Goi Tbill
| Date |
Closing |
Open |
Range |
Volume |
Wed 03 September 2025 |
99.40 (0.12%) |
99.36 |
99.22 - 99.40 |
1.3164 times |
Tue 26 August 2025 |
99.28 (0.73%) |
98.66 |
98.66 - 99.29 |
2.5989 times |
Tue 29 July 2025 |
98.56 (0.26%) |
98.09 |
98.09 - 98.70 |
1.2486 times |
Wed 25 June 2025 |
98.30 (0.87%) |
97.45 |
97.45 - 98.43 |
0.6836 times |
Tue 13 May 2025 |
97.45 (0.62%) |
96.98 |
96.98 - 97.45 |
0.0282 times |
Mon 28 April 2025 |
96.85 (0%) |
96.70 |
96.70 - 96.85 |
0.1243 times |
Thu 04 September 2025 |
(0%) |
|
- |
0 times |

DMA SMA EMA moving averages of Goi Tbill 182D101025_TB
DMA (daily moving average) of Goi Tbill 182D101025_TB
| DMA period | DMA value | | 5 day DMA | 99.34 | | 12 day DMA | 99.04 | | 20 day DMA | 98.73 | | 35 day DMA | | | 50 day DMA | | | 100 day DMA | | | 150 day DMA | | | 200 day DMA | | EMA (exponential moving average) of Goi Tbill 182D101025_TB
| EMA period | EMA current | EMA prev | EMA prev2 | | 5 day EMA | 99.31 | 99.27 | 99.21 | | 12 day EMA | 99.04 | 98.98 | 98.91 | | 20 day EMA | 98.76 | 98.69 | 98.62 | | 35 day EMA | 0 | 0 | 0 | | 50 day EMA | 0 | 0 | 0 |
SMA (simple moving average) of Goi Tbill 182D101025_TB
| SMA period | SMA current | SMA prev | SMA prev2 | | 5 day SMA | 99.34 | 99.31 | 99.19 | | 12 day SMA | 99.04 | 98.97 | 98.88 | | 20 day SMA | 98.73 | 98.67 | 98.6 | | 35 day SMA | | 50 day SMA | | 100 day SMA | | 150 day SMA | | 200 day SMA |
|
|
