Esfb11 113ESFB31_N0 full analysis,charts,indicators,moving averages,SMA,DMA,EMA,ADX,MACD,RSIEsfb 11 113ESFB31_N0 WideScreen charts, DMA,SMA,EMA technical analysis, forecast prediction, by indicators ADX,MACD,RSI,CCI NSE stock exchange
Daily price and charts and targets Esfb11 Strong Daily Stock price targets for Esfb11 113ESFB31_N0 are 100350 and 100350 | Daily Target 1 | 100350 | | Daily Target 2 | 100350 | | Daily Target 3 | 100350 | | Daily Target 4 | 100350 | | Daily Target 5 | 100350 |
Daily price and volume Esfb 11
| Date |
Closing |
Open |
Range |
Volume |
Wed 29 October 2025 |
100350.00 (-0.92%) |
100350.00 |
100350.00 - 100350.00 |
0.0617 times |
Fri 24 October 2025 |
101285.36 (0.28%) |
101285.36 |
101285.36 - 101285.36 |
0.5556 times |
Thu 23 October 2025 |
100999.00 (0.67%) |
100999.00 |
100999.00 - 100999.00 |
0.0617 times |
Fri 17 October 2025 |
100326.55 (-0.55%) |
100326.55 |
100326.55 - 100326.55 |
0.3086 times |
Fri 10 October 2025 |
100881.53 (0.09%) |
100881.53 |
100881.53 - 100881.53 |
1.2346 times |
Thu 09 October 2025 |
100787.36 (0.06%) |
100787.36 |
100787.36 - 100787.36 |
6.1728 times |
Tue 07 October 2025 |
100724.54 (0.03%) |
100724.54 |
100724.54 - 101000.00 |
0.4321 times |
Mon 06 October 2025 |
100693.18 (0.03%) |
100693.18 |
100693.18 - 100693.18 |
0.1235 times |
Fri 03 October 2025 |
100661.82 (1.16%) |
100661.82 |
100661.82 - 100661.82 |
0.3086 times |
Tue 23 September 2025 |
99504.02 (-0.61%) |
100115.00 |
99504.02 - 100115.00 |
0.7407 times |
Mon 22 September 2025 |
100115.00 (0%) |
100114.52 |
100000.00 - 100115.00 |
0.3086 times |
Weekly price and charts Esfb11 Strong weekly Stock price targets for Esfb11 113ESFB31_N0 are 100350 and 100350 | Weekly Target 1 | 100350 | | Weekly Target 2 | 100350 | | Weekly Target 3 | 100350 | | Weekly Target 4 | 100350 | | Weekly Target 5 | 100350 |
Weekly price and volumes for Esfb 11
| Date |
Closing |
Open |
Range |
Volume |
Wed 29 October 2025 |
100350.00 (-0.92%) |
100350.00 |
100350.00 - 100350.00 |
0.0402 times |
Fri 24 October 2025 |
101285.36 (0.96%) |
100999.00 |
100999.00 - 101285.36 |
0.4018 times |
Fri 17 October 2025 |
100326.55 (-0.55%) |
100326.55 |
100326.55 - 100326.55 |
0.2009 times |
Fri 10 October 2025 |
100881.53 (0.22%) |
100693.18 |
100693.18 - 101000.00 |
5.1828 times |
Fri 03 October 2025 |
100661.82 (0.55%) |
100114.52 |
99504.02 - 100661.82 |
0.8839 times |
Thu 18 September 2025 |
100114.52 (0.22%) |
100114.52 |
100114.52 - 100114.52 |
0.2009 times |
Thu 11 September 2025 |
99897.81 (0.09%) |
100999.99 |
99897.81 - 101000.00 |
0.5223 times |
Fri 05 September 2025 |
99804.93 (0.03%) |
99619.18 |
99619.18 - 99804.93 |
0.5223 times |
Fri 29 August 2025 |
99775.26 (0%) |
99900.00 |
99775.26 - 99900.00 |
1.0446 times |
Wed 29 October 2025 |
(0%) |
|
- |
0 times |

Monthly price and charts Esfb11 Strong monthly Stock price targets for Esfb11 113ESFB31_N0 are 99858.87 and 100817.68 | Monthly Target 1 | 99695.16 | | Monthly Target 2 | 100022.58 | | Monthly Target 3 | 100653.97 | | Monthly Target 4 | 100981.39 | | Monthly Target 5 | 101612.78 |
Monthly price and volumes Esfb 11
| Date |
Closing |
Open |
Range |
Volume |
Wed 29 October 2025 |
100350.00 (0.85%) |
100661.82 |
100326.55 - 101285.36 |
2.0088 times |
Tue 23 September 2025 |
99504.02 (-0.27%) |
99619.18 |
99504.02 - 101000.00 |
0.6428 times |
Fri 29 August 2025 |
99775.26 (0%) |
99900.00 |
99775.26 - 99900.00 |
0.3482 times |
Wed 29 October 2025 |
(0%) |
|
- |
0 times |

DMA SMA EMA moving averages of Esfb 11 113ESFB31_N0
DMA (daily moving average) of Esfb 11 113ESFB31_N0
| DMA period | DMA value | | 5 day DMA | 100768.49 | | 12 day DMA | 100536.91 | | 20 day DMA | | | 35 day DMA | | | 50 day DMA | | | 100 day DMA | | | 150 day DMA | | | 200 day DMA | | EMA (exponential moving average) of Esfb 11 113ESFB31_N0
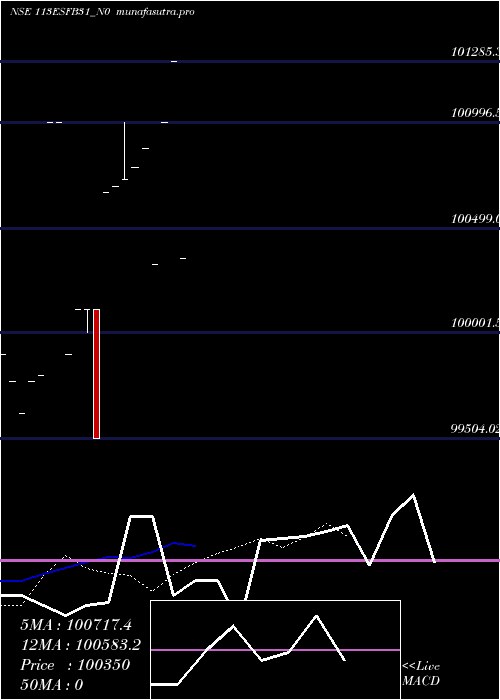
| EMA period | EMA current | EMA prev | EMA prev2 | | 5 day EMA | 100717.37 | 100901.03 | 100708.9 | | 12 day EMA | 100583.23 | 100625.62 | 100505.71 | | 20 day EMA | 100360.74 | | 35 day EMA | 0 | 0 | 0 | | 50 day EMA | 0 | 0 | 0 |
SMA (simple moving average) of Esfb 11 113ESFB31_N0
| SMA period | SMA current | SMA prev | SMA prev2 | | 5 day SMA | 100768.49 | 100855.96 | 100743.8 | | 12 day SMA | 100536.91 | 100499.22 | 100475.44 | | 20 day SMA | | 35 day SMA | | 50 day SMA | | 100 day SMA | | 150 day SMA | | 200 day SMA |
|
|
