SecRed 10NIDO26_N6 full analysis,charts,indicators,moving averages,SMA,DMA,EMA,ADX,MACD,RSISec Red 10NIDO26_N6 WideScreen charts, DMA,SMA,EMA technical analysis, forecast prediction, by indicators ADX,MACD,RSI,CCI NSE stock exchange
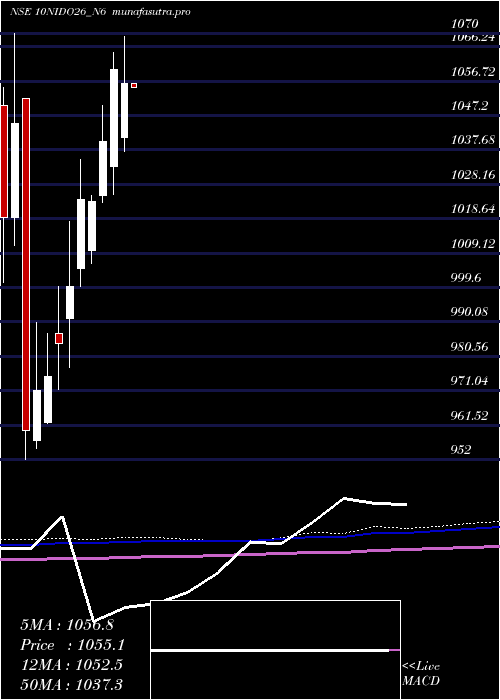
Daily price and charts and targets SecRed Strong Daily Stock price targets for SecRed 10NIDO26_N6 are 1009.55 and 1020.45 | Daily Target 1 | 1007.07 | | Daily Target 2 | 1011.03 | | Daily Target 3 | 1017.9666666667 | | Daily Target 4 | 1021.93 | | Daily Target 5 | 1028.87 |
Daily price and volume Sec Red
| Date |
Closing |
Open |
Range |
Volume |
Tue 28 October 2025 |
1015.00 (0%) |
1015.00 |
1014.00 - 1024.90 |
1.1452 times |
Mon 27 October 2025 |
1015.00 (-0.29%) |
1017.97 |
1007.50 - 1020.00 |
2.2858 times |
Fri 24 October 2025 |
1017.97 (0.29%) |
1011.00 |
1010.00 - 1018.89 |
1.5678 times |
Thu 23 October 2025 |
1015.00 (0%) |
1019.00 |
1015.00 - 1019.00 |
0.2431 times |
Tue 21 October 2025 |
1015.00 (0%) |
1015.00 |
1015.00 - 1015.00 |
0.3613 times |
Mon 20 October 2025 |
1015.00 (0%) |
1007.20 |
1007.20 - 1015.00 |
0.2249 times |
Fri 17 October 2025 |
1015.00 (0.19%) |
1015.00 |
1011.50 - 1015.00 |
0.3158 times |
Thu 16 October 2025 |
1013.07 (0.28%) |
1013.00 |
1012.05 - 1013.10 |
1.5565 times |
Wed 15 October 2025 |
1010.20 (0.01%) |
1015.20 |
1010.20 - 1015.20 |
0.0273 times |
Tue 14 October 2025 |
1010.10 (0.01%) |
1010.00 |
1007.20 - 1012.05 |
2.2722 times |
Mon 13 October 2025 |
1010.00 (-0.59%) |
1007.00 |
976.00 - 1010.00 |
0.7044 times |
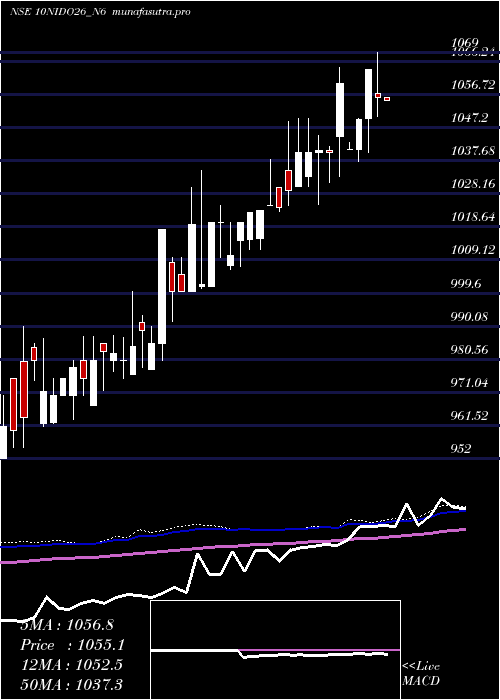
Weekly price and charts SecRed Strong weekly Stock price targets for SecRed 10NIDO26_N6 are 1002.55 and 1019.95 | Weekly Target 1 | 998.4 | | Weekly Target 2 | 1006.7 | | Weekly Target 3 | 1015.8 | | Weekly Target 4 | 1024.1 | | Weekly Target 5 | 1033.2 |
Weekly price and volumes for Sec Red
| Date |
Closing |
Open |
Range |
Volume |
Tue 28 October 2025 |
1015.00 (-0.29%) |
1017.97 |
1007.50 - 1024.90 |
0.995 times |
Fri 24 October 2025 |
1017.97 (0.29%) |
1007.20 |
1007.20 - 1019.00 |
0.6952 times |
Fri 17 October 2025 |
1015.00 (-0.1%) |
1007.00 |
976.00 - 1015.20 |
1.4141 times |
Fri 10 October 2025 |
1016.00 (0.61%) |
1009.83 |
1005.50 - 1017.40 |
0.74 times |
Fri 03 October 2025 |
1009.83 (0.26%) |
1007.00 |
1005.00 - 1014.90 |
0.2919 times |
Fri 26 September 2025 |
1007.19 (-0.28%) |
1010.00 |
1002.20 - 1014.84 |
3.1023 times |
Fri 19 September 2025 |
1010.00 (0.7%) |
1005.00 |
1002.25 - 1014.29 |
0.9172 times |
Wed 10 September 2025 |
1003.02 (-0.08%) |
1001.50 |
977.19 - 1010.00 |
0.1898 times |
Fri 05 September 2025 |
1003.82 (-0.02%) |
1000.00 |
983.10 - 1014.95 |
0.5568 times |
Thu 28 August 2025 |
1004.00 (0.5%) |
985.00 |
985.00 - 1021.89 |
1.0978 times |
Wed 20 August 2025 |
999.00 (-0.1%) |
999.00 |
993.00 - 999.00 |
0.0507 times |
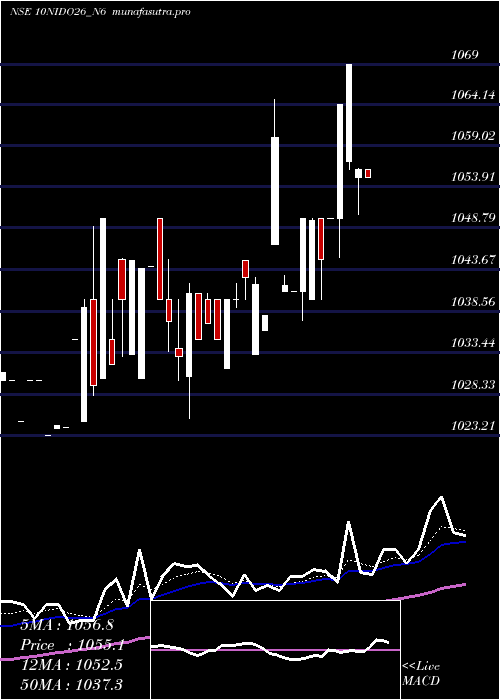
Monthly price and charts SecRed Strong monthly Stock price targets for SecRed 10NIDO26_N6 are 995.5 and 1044.4 | Monthly Target 1 | 956.4 | | Monthly Target 2 | 985.7 | | Monthly Target 3 | 1005.3 | | Monthly Target 4 | 1034.6 | | Monthly Target 5 | 1054.2 |
Monthly price and volumes Sec Red
| Date |
Closing |
Open |
Range |
Volume |
Tue 28 October 2025 |
1015.00 (0.38%) |
1014.90 |
976.00 - 1024.90 |
0.8447 times |
Tue 30 September 2025 |
1011.19 (0.72%) |
1000.00 |
977.19 - 1014.95 |
1.0507 times |
Thu 28 August 2025 |
1004.00 (1.21%) |
995.00 |
985.00 - 1021.89 |
1.2045 times |
Thu 31 July 2025 |
992.00 (-7.81%) |
1083.00 |
973.20 - 1083.00 |
1.3452 times |
Fri 27 June 2025 |
1076.00 (0.55%) |
1070.50 |
1050.00 - 1080.80 |
0.588 times |
Fri 30 May 2025 |
1070.10 (1.33%) |
1056.02 |
1055.10 - 1070.10 |
1.2212 times |
Tue 29 April 2025 |
1056.02 (-0.38%) |
1041.00 |
1037.40 - 1069.00 |
0.2593 times |
Fri 28 March 2025 |
1060.00 (1.92%) |
1033.20 |
1025.30 - 1064.74 |
1.791 times |
Fri 28 February 2025 |
1040.00 (1.61%) |
1025.00 |
1023.21 - 1050.00 |
0.6541 times |
Thu 30 January 2025 |
1023.48 (-0.05%) |
1010.00 |
1006.20 - 1025.00 |
1.0414 times |
Tue 31 December 2024 |
1024.00 (2.4%) |
1005.00 |
1000.00 - 1035.00 |
1.1621 times |
DMA SMA EMA moving averages of Sec Red 10NIDO26_N6
DMA (daily moving average) of Sec Red 10NIDO26_N6
| DMA period | DMA value | | 5 day DMA | 1015.59 | | 12 day DMA | 1013.95 | | 20 day DMA | 1012.89 | | 35 day DMA | 1010.1 | | 50 day DMA | 1007.11 | | 100 day DMA | 1023.52 | | 150 day DMA | 1028.72 | | 200 day DMA | 1022.32 | EMA (exponential moving average) of Sec Red 10NIDO26_N6
| EMA period | EMA current | EMA prev | EMA prev2 | | 5 day EMA | 1015.25 | 1015.37 | 1015.56 | | 12 day EMA | 1014.15 | 1013.99 | 1013.81 | | 20 day EMA | 1012.71 | 1012.47 | 1012.2 | | 35 day EMA | 1009.81 | 1009.5 | 1009.18 | | 50 day EMA | 1006.89 | 1006.56 | 1006.22 |
SMA (simple moving average) of Sec Red 10NIDO26_N6
| SMA period | SMA current | SMA prev | SMA prev2 | | 5 day SMA | 1015.59 | 1015.59 | 1015.59 | | 12 day SMA | 1013.95 | 1013.7 | 1013.45 | | 20 day SMA | 1012.89 | 1012.5 | 1012.38 | | 35 day SMA | 1010.1 | 1009.93 | 1009.92 | | 50 day SMA | 1007.11 | 1006.71 | 1006.31 | | 100 day SMA | 1023.52 | 1023.98 | 1024.44 | | 150 day SMA | 1028.72 | 1028.7 | 1028.7 | | 200 day SMA | 1022.32 | 1022.12 | 1021.95 |
|
|
