SecRe 10ISFL26_N3 full analysis,charts,indicators,moving averages,SMA,DMA,EMA,ADX,MACD,RSISec Re 10ISFL26_N3 WideScreen charts, DMA,SMA,EMA technical analysis, forecast prediction, by indicators ADX,MACD,RSI,CCI NSE stock exchange
Daily price and charts and targets SecRe Strong Daily Stock price targets for SecRe 10ISFL26_N3 are 1009.68 and 1009.93 | Daily Target 1 | 1009.47 | | Daily Target 2 | 1009.63 | | Daily Target 3 | 1009.7166666667 | | Daily Target 4 | 1009.88 | | Daily Target 5 | 1009.97 |
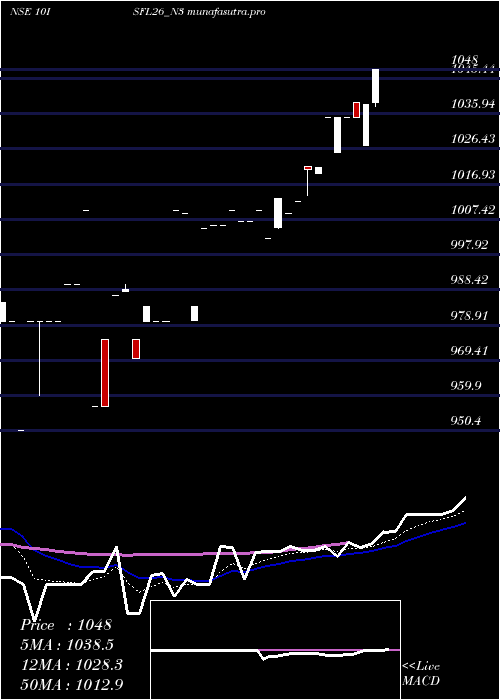
Daily price and volume Sec Re
| Date |
Closing |
Open |
Range |
Volume |
Tue 09 December 2025 |
1009.80 (-1.48%) |
1009.55 |
1009.55 - 1009.80 |
0.5976 times |
Fri 05 December 2025 |
1025.00 (-5.53%) |
1055.00 |
1024.55 - 1055.00 |
1.5993 times |
Wed 03 December 2025 |
1085.00 (0.65%) |
1085.00 |
1085.00 - 1085.00 |
0.1599 times |
Mon 01 December 2025 |
1078.00 (-0.55%) |
1079.99 |
1074.99 - 1079.99 |
2.5589 times |
Fri 28 November 2025 |
1084.00 (0.09%) |
1084.00 |
1084.00 - 1084.00 |
0.4209 times |
Fri 21 November 2025 |
1083.00 (0%) |
1083.00 |
1083.00 - 1083.00 |
0.4125 times |
Wed 19 November 2025 |
1083.00 (0.28%) |
1083.00 |
1083.00 - 1083.00 |
1.9444 times |
Tue 18 November 2025 |
1080.00 (-0.28%) |
1080.00 |
1080.00 - 1080.00 |
0.8418 times |
Mon 17 November 2025 |
1083.00 (0.19%) |
1083.00 |
1083.00 - 1083.00 |
0.404 times |
Wed 12 November 2025 |
1081.00 (-0.09%) |
1083.00 |
1081.00 - 1083.00 |
1.0606 times |
Tue 11 November 2025 |
1082.00 (0.11%) |
1082.00 |
1082.00 - 1082.00 |
0.6734 times |
Weekly price and charts SecRe Strong weekly Stock price targets for SecRe 10ISFL26_N3 are 1009.68 and 1009.93 | Weekly Target 1 | 1009.47 | | Weekly Target 2 | 1009.63 | | Weekly Target 3 | 1009.7166666667 | | Weekly Target 4 | 1009.88 | | Weekly Target 5 | 1009.97 |
Weekly price and volumes for Sec Re
| Date |
Closing |
Open |
Range |
Volume |
Tue 09 December 2025 |
1009.80 (-1.48%) |
1009.55 |
1009.55 - 1009.80 |
0.3035 times |
Fri 05 December 2025 |
1025.00 (-5.44%) |
1079.99 |
1024.55 - 1085.00 |
2.1932 times |
Fri 28 November 2025 |
1084.00 (0.09%) |
1084.00 |
1084.00 - 1084.00 |
0.2138 times |
Fri 21 November 2025 |
1083.00 (0.19%) |
1083.00 |
1080.00 - 1083.00 |
1.8298 times |
Wed 12 November 2025 |
1081.00 (-0.09%) |
1082.00 |
1080.80 - 1083.00 |
1.351 times |
Fri 07 November 2025 |
1082.00 (1.59%) |
1065.35 |
1065.35 - 1083.49 |
1.0047 times |
Thu 23 October 2025 |
1065.10 (0.65%) |
1072.00 |
1065.00 - 1072.00 |
1.0817 times |
Wed 15 October 2025 |
1058.20 (-1.56%) |
1058.20 |
1058.20 - 1058.20 |
0.0428 times |
Fri 10 October 2025 |
1075.00 (-0.14%) |
1050.00 |
1047.00 - 1075.00 |
1.7657 times |
Fri 12 September 2025 |
1076.50 (0.98%) |
1068.00 |
1068.00 - 1076.50 |
0.2138 times |
Fri 22 August 2025 |
1066.00 (3.03%) |
1034.60 |
1034.60 - 1066.00 |
0.513 times |

Monthly price and charts SecRe Strong monthly Stock price targets for SecRe 10ISFL26_N3 are 971.95 and 1047.4 | Monthly Target 1 | 959.33 | | Monthly Target 2 | 984.57 | | Monthly Target 3 | 1034.7833333333 | | Monthly Target 4 | 1060.02 | | Monthly Target 5 | 1110.23 |
Monthly price and volumes Sec Re
| Date |
Closing |
Open |
Range |
Volume |
Tue 09 December 2025 |
1009.80 (-6.85%) |
1079.99 |
1009.55 - 1085.00 |
0.7667 times |
Fri 28 November 2025 |
1084.00 (1.77%) |
1065.35 |
1065.35 - 1084.00 |
1.3509 times |
Thu 23 October 2025 |
1065.10 (1.42%) |
1075.00 |
1058.20 - 1075.00 |
0.4766 times |
Thu 18 September 2025 |
1050.20 (-1.48%) |
1068.00 |
1047.00 - 1076.50 |
0.4766 times |
Fri 22 August 2025 |
1066.00 (2.5%) |
1045.80 |
1032.20 - 1066.00 |
0.81 times |
Thu 31 July 2025 |
1040.00 (1.81%) |
1035.00 |
1020.00 - 1048.00 |
2.3841 times |
Thu 19 June 2025 |
1021.51 (0.83%) |
1009.00 |
1009.00 - 1021.80 |
2.1203 times |
Tue 27 May 2025 |
1013.13 (0.73%) |
1005.80 |
1002.20 - 1013.13 |
0.7943 times |
Mon 21 April 2025 |
1005.80 (-0.32%) |
980.20 |
980.20 - 1005.80 |
0.34 times |
Tue 18 March 2025 |
1009.00 (2.56%) |
980.00 |
980.00 - 1010.00 |
0.4805 times |
Thu 20 February 2025 |
983.80 (2.79%) |
975.00 |
957.06 - 990.00 |
2.1255 times |

DMA SMA EMA moving averages of Sec Re 10ISFL26_N3
DMA (daily moving average) of Sec Re 10ISFL26_N3
| DMA period | DMA value | | 5 day DMA | 1056.36 | | 12 day DMA | 1071.22 | | 20 day DMA | 1070.3 | | 35 day DMA | 1062.37 | | 50 day DMA | 1050.73 | | 100 day DMA | 1029.33 | | 150 day DMA | | | 200 day DMA | | EMA (exponential moving average) of Sec Re 10ISFL26_N3
| EMA period | EMA current | EMA prev | EMA prev2 | | 5 day EMA | 1045.43 | 1063.24 | 1082.35 | | 12 day EMA | 1061.63 | 1071.05 | 1079.42 | | 20 day EMA | 1063.71 | 1069.38 | 1074.05 | | 35 day EMA | 1057.27 | 1060.07 | 1062.13 | | 50 day EMA | 1047.39 | 1048.92 | 1049.9 |
SMA (simple moving average) of Sec Re 10ISFL26_N3
| SMA period | SMA current | SMA prev | SMA prev2 | | 5 day SMA | 1056.36 | 1071 | 1082.6 | | 12 day SMA | 1071.22 | 1077.23 | 1082.11 | | 20 day SMA | 1070.3 | 1072.56 | 1073.8 | | 35 day SMA | 1062.37 | 1062.98 | 1063.64 | | 50 day SMA | 1050.73 | 1050.68 | 1050.38 | | 100 day SMA | 1029.33 | 1029.03 | 1028.91 | | 150 day SMA | | 200 day SMA |
|
|
