SecRe 10CAGL27_N5 full analysis,charts,indicators,moving averages,SMA,DMA,EMA,ADX,MACD,RSISec Re 10CAGL27_N5 WideScreen charts, DMA,SMA,EMA technical analysis, forecast prediction, by indicators ADX,MACD,RSI,CCI NSE stock exchange
Daily price and charts and targets SecRe Strong Daily Stock price targets for SecRe 10CAGL27_N5 are 1024.85 and 1024.85 | Daily Target 1 | 1024.85 | | Daily Target 2 | 1024.85 | | Daily Target 3 | 1024.85 | | Daily Target 4 | 1024.85 | | Daily Target 5 | 1024.85 |
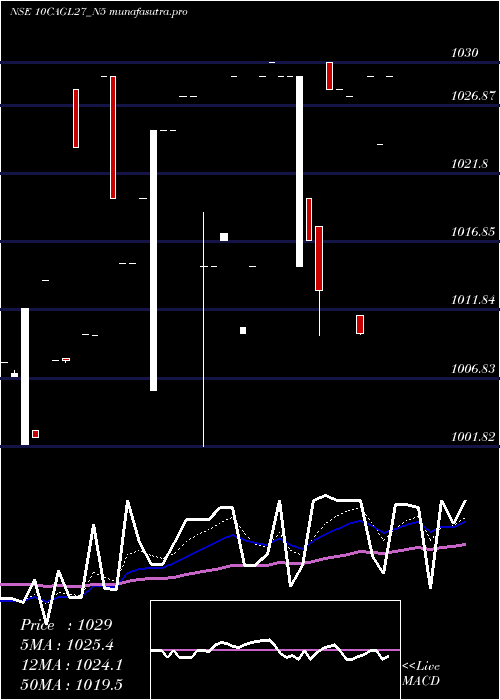
Daily price and volume Sec Re
| Date |
Closing |
Open |
Range |
Volume |
Tue 28 October 2025 |
1024.85 (-0.5%) |
1024.85 |
1024.85 - 1024.85 |
0.4085 times |
Mon 27 October 2025 |
1030.00 (1.28%) |
1030.00 |
1030.00 - 1030.00 |
0.0105 times |
Fri 24 October 2025 |
1017.00 (-0.1%) |
1029.99 |
1017.00 - 1032.99 |
0.8904 times |
Thu 23 October 2025 |
1018.00 (0.3%) |
1017.00 |
1017.00 - 1018.00 |
0.1467 times |
Fri 17 October 2025 |
1015.00 (0.34%) |
1015.00 |
1015.00 - 1015.00 |
2.0951 times |
Thu 16 October 2025 |
1011.60 (-0.34%) |
1011.60 |
1011.60 - 1011.60 |
0.0419 times |
Tue 14 October 2025 |
1015.10 (0.37%) |
1015.10 |
1015.10 - 1015.10 |
0.021 times |
Mon 13 October 2025 |
1011.35 (-0.36%) |
1011.35 |
1011.35 - 1011.35 |
0.0105 times |
Tue 07 October 2025 |
1015.00 (-0.2%) |
1017.00 |
1015.00 - 1017.00 |
3.4758 times |
Mon 06 October 2025 |
1017.00 (0.2%) |
1016.00 |
1016.00 - 1017.00 |
2.8996 times |
Fri 03 October 2025 |
1015.00 (0.24%) |
1017.00 |
1014.00 - 1017.00 |
1.8982 times |
Weekly price and charts SecRe Strong weekly Stock price targets for SecRe 10CAGL27_N5 are 1022.28 and 1027.43 | Weekly Target 1 | 1021.42 | | Weekly Target 2 | 1023.13 | | Weekly Target 3 | 1026.5666666667 | | Weekly Target 4 | 1028.28 | | Weekly Target 5 | 1031.72 |
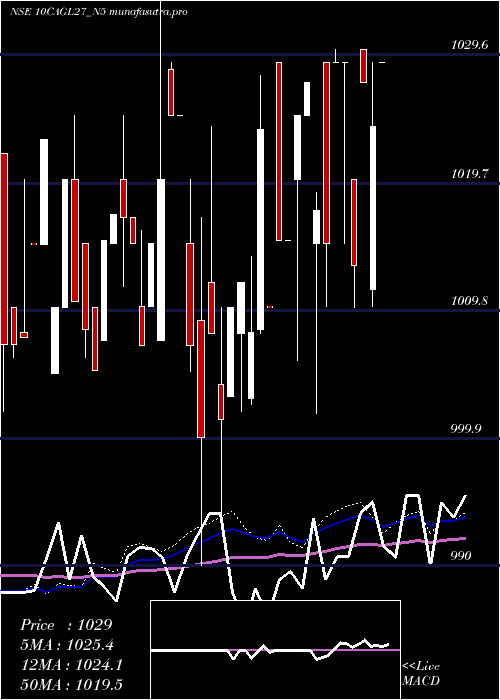
Weekly price and volumes for Sec Re
| Date |
Closing |
Open |
Range |
Volume |
Tue 28 October 2025 |
1024.85 (0.77%) |
1030.00 |
1024.85 - 1030.00 |
0.2249 times |
Fri 24 October 2025 |
1017.00 (0.2%) |
1017.00 |
1017.00 - 1032.99 |
0.5567 times |
Fri 17 October 2025 |
1015.00 (0%) |
1011.35 |
1011.35 - 1015.10 |
1.164 times |
Tue 07 October 2025 |
1015.00 (0%) |
1016.00 |
1015.00 - 1017.00 |
3.4222 times |
Fri 03 October 2025 |
1015.00 (-0.51%) |
1011.00 |
1011.00 - 1025.00 |
2.554 times |
Thu 25 September 2025 |
1020.20 (0.51%) |
1013.00 |
1013.00 - 1089.99 |
1.2719 times |
Fri 12 September 2025 |
1015.00 (-0.49%) |
1020.00 |
1015.00 - 1020.00 |
0.3295 times |
Thu 28 August 2025 |
1020.00 (0.39%) |
1020.00 |
1020.00 - 1020.00 |
0.1136 times |
Fri 22 August 2025 |
1016.05 (-0.39%) |
1014.00 |
1014.00 - 1026.00 |
0.3576 times |
Wed 13 August 2025 |
1020.00 (-0.77%) |
1020.00 |
1020.00 - 1020.00 |
0.0056 times |
Fri 01 August 2025 |
1027.95 (0.78%) |
1020.00 |
1020.00 - 1028.95 |
0.0461 times |
Monthly price and charts SecRe Strong monthly Stock price targets for SecRe 10CAGL27_N5 are 1018.1 and 1039.74 | Monthly Target 1 | 1001.42 | | Monthly Target 2 | 1013.14 | | Monthly Target 3 | 1023.0633333333 | | Monthly Target 4 | 1034.78 | | Monthly Target 5 | 1044.7 |
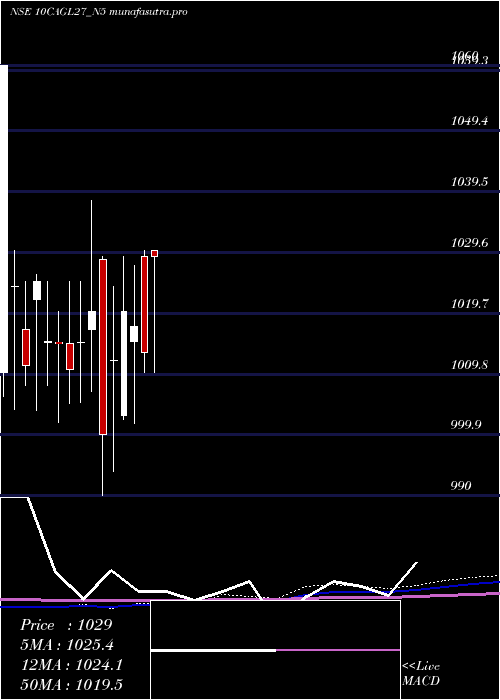
Monthly price and volumes Sec Re
| Date |
Closing |
Open |
Range |
Volume |
Tue 28 October 2025 |
1024.85 (1.21%) |
1017.00 |
1011.35 - 1032.99 |
2.5734 times |
Tue 30 September 2025 |
1012.55 (-0.73%) |
1020.00 |
1011.00 - 1089.99 |
1.2638 times |
Thu 28 August 2025 |
1020.00 (-0.87%) |
1027.95 |
1014.00 - 1027.95 |
0.2007 times |
Thu 31 July 2025 |
1028.95 (1.55%) |
1030.00 |
1010.10 - 1030.00 |
0.3109 times |
Thu 26 June 2025 |
1013.29 (-0.41%) |
1029.00 |
1010.00 - 1030.00 |
0.2035 times |
Thu 29 May 2025 |
1017.50 (-0.25%) |
1015.20 |
1001.82 - 1027.50 |
0.749 times |
Wed 30 April 2025 |
1020.00 (0.79%) |
1003.00 |
1002.50 - 1029.00 |
0.2465 times |
Wed 26 March 2025 |
1012.00 (1.2%) |
1012.00 |
994.00 - 1024.00 |
1.1025 times |
Fri 28 February 2025 |
1000.00 (-1.96%) |
1028.50 |
990.00 - 1029.00 |
2.0627 times |
Fri 31 January 2025 |
1020.00 (0.49%) |
1017.00 |
1007.08 - 1038.00 |
1.2869 times |
Tue 31 December 2024 |
1015.00 (0.45%) |
1015.00 |
1005.15 - 1025.00 |
0.6997 times |
DMA SMA EMA moving averages of Sec Re 10CAGL27_N5
DMA (daily moving average) of Sec Re 10CAGL27_N5
| DMA period | DMA value | | 5 day DMA | 1020.97 | | 12 day DMA | 1016.87 | | 20 day DMA | 1016.83 | | 35 day DMA | 1018.96 | | 50 day DMA | 1020.11 | | 100 day DMA | 1016.68 | | 150 day DMA | 1015.55 | | 200 day DMA | 1015.9 | EMA (exponential moving average) of Sec Re 10CAGL27_N5
| EMA period | EMA current | EMA prev | EMA prev2 | | 5 day EMA | 1022 | 1020.58 | 1015.87 | | 12 day EMA | 1018.87 | 1017.78 | 1015.56 | | 20 day EMA | 1018.29 | 1017.6 | 1016.3 | | 35 day EMA | 1018.88 | 1018.53 | 1017.86 | | 50 day EMA | 1020.4 | 1020.22 | 1019.82 |
SMA (simple moving average) of Sec Re 10CAGL27_N5
| SMA period | SMA current | SMA prev | SMA prev2 | | 5 day SMA | 1020.97 | 1018.32 | 1015.34 | | 12 day SMA | 1016.87 | 1015.72 | 1014.9 | | 20 day SMA | 1016.83 | 1016.59 | 1015.89 | | 35 day SMA | 1018.96 | 1018.54 | 1018.47 | | 50 day SMA | 1020.11 | 1019.92 | 1019.62 | | 100 day SMA | 1016.68 | 1016.58 | 1016.43 | | 150 day SMA | 1015.55 | 1015.55 | 1015.46 | | 200 day SMA | 1015.9 | 1015.82 | 1015.97 |
|
|
