SecRe 1075SCL33A_N2 full analysis,charts,indicators,moving averages,SMA,DMA,EMA,ADX,MACD,RSISec Re 1075SCL33A_N2 WideScreen charts, DMA,SMA,EMA technical analysis, forecast prediction, by indicators ADX,MACD,RSI,CCI NSE stock exchange
Daily price and charts and targets SecRe Strong Daily Stock price targets for SecRe 1075SCL33A_N2 are 997 and 999 | Daily Target 1 | 996.67 | | Daily Target 2 | 997.33 | | Daily Target 3 | 998.66666666667 | | Daily Target 4 | 999.33 | | Daily Target 5 | 1000.67 |
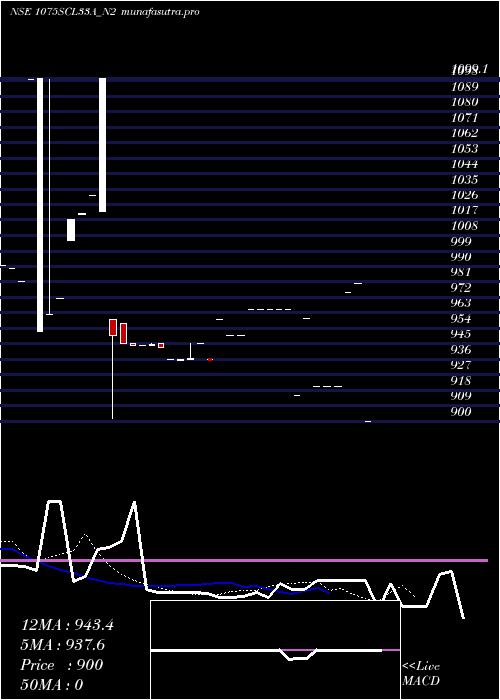
Daily price and volume Sec Re
| Date |
Closing |
Open |
Range |
Volume |
Tue 28 October 2025 |
998.00 (1.84%) |
1000.00 |
998.00 - 1000.00 |
0.2623 times |
Fri 24 October 2025 |
980.00 (8.89%) |
980.00 |
980.00 - 980.00 |
1.6393 times |
Thu 23 October 2025 |
900.00 (-10%) |
900.00 |
900.00 - 990.00 |
1.7213 times |
Tue 21 October 2025 |
1000.00 (11.11%) |
1000.00 |
1000.00 - 1000.00 |
0.1639 times |
Fri 03 October 2025 |
900.00 (0%) |
900.00 |
900.00 - 900.00 |
0.2951 times |
Thu 25 September 2025 |
900.00 (0%) |
900.00 |
900.00 - 900.00 |
0.1639 times |
Fri 19 September 2025 |
900.00 (-0.11%) |
900.00 |
900.00 - 900.00 |
0.8361 times |
Tue 16 September 2025 |
901.00 (-5.16%) |
901.00 |
901.00 - 901.00 |
0.6557 times |
Wed 13 August 2025 |
950.00 (5.56%) |
950.00 |
950.00 - 950.00 |
4.0984 times |
Fri 23 May 2025 |
900.00 (-8.16%) |
900.00 |
900.00 - 900.00 |
0.1639 times |
Tue 20 May 2025 |
980.00 (0.51%) |
980.00 |
980.00 - 980.00 |
2.3443 times |
Weekly price and charts SecRe Strong weekly Stock price targets for SecRe 1075SCL33A_N2 are 997 and 999 | Weekly Target 1 | 996.67 | | Weekly Target 2 | 997.33 | | Weekly Target 3 | 998.66666666667 | | Weekly Target 4 | 999.33 | | Weekly Target 5 | 1000.67 |
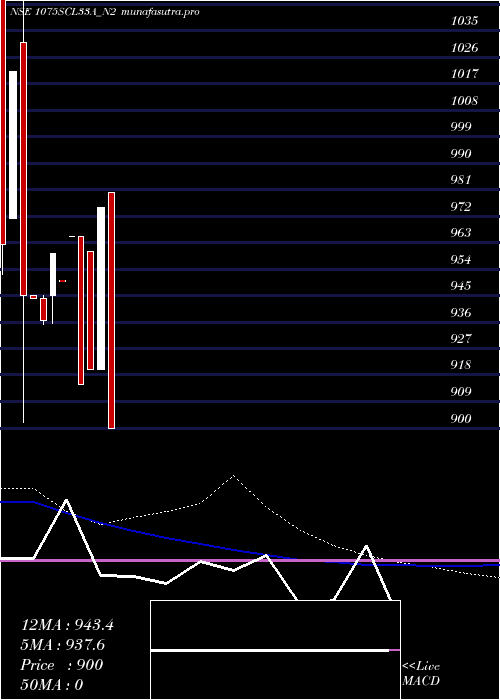
Weekly price and volumes for Sec Re
| Date |
Closing |
Open |
Range |
Volume |
Tue 28 October 2025 |
998.00 (1.84%) |
1000.00 |
998.00 - 1000.00 |
0.0686 times |
Fri 24 October 2025 |
980.00 (8.89%) |
1000.00 |
900.00 - 1000.00 |
0.9216 times |
Fri 03 October 2025 |
900.00 (0%) |
900.00 |
900.00 - 900.00 |
0.12 times |
Fri 19 September 2025 |
900.00 (-5.26%) |
901.00 |
900.00 - 901.00 |
0.3901 times |
Wed 13 August 2025 |
950.00 (5.56%) |
950.00 |
950.00 - 950.00 |
1.0716 times |
Fri 23 May 2025 |
900.00 (-7.69%) |
980.00 |
900.00 - 980.00 |
0.6558 times |
Wed 05 March 2025 |
975.00 (5.98%) |
920.00 |
920.00 - 975.00 |
6.2409 times |
Thu 27 February 2025 |
920.00 (0.55%) |
959.90 |
920.00 - 959.90 |
0.3386 times |
Fri 17 January 2025 |
915.00 (-5.18%) |
965.00 |
915.00 - 965.00 |
0.0643 times |
Thu 28 November 2024 |
965.00 (1.59%) |
965.00 |
965.00 - 965.00 |
0.1286 times |
Fri 08 November 2024 |
949.90 (-0.99%) |
950.05 |
949.90 - 950.05 |
0.8573 times |
Monthly price and charts SecRe Strong monthly Stock price targets for SecRe 1075SCL33A_N2 are 949 and 1049 | Monthly Target 1 | 866 | | Monthly Target 2 | 932 | | Monthly Target 3 | 966 | | Monthly Target 4 | 1032 | | Monthly Target 5 | 1066 |
Monthly price and volumes Sec Re
| Date |
Closing |
Open |
Range |
Volume |
Tue 28 October 2025 |
998.00 (10.89%) |
900.00 |
900.00 - 1000.00 |
0.9625 times |
Thu 25 September 2025 |
900.00 (-5.26%) |
901.00 |
900.00 - 901.00 |
0.3904 times |
Wed 13 August 2025 |
950.00 (5.56%) |
950.00 |
950.00 - 950.00 |
0.9664 times |
Fri 23 May 2025 |
900.00 (-7.69%) |
980.00 |
900.00 - 980.00 |
0.5914 times |
Wed 05 March 2025 |
975.00 (5.98%) |
920.00 |
920.00 - 975.00 |
5.6281 times |
Thu 27 February 2025 |
920.00 (0.55%) |
959.90 |
920.00 - 959.90 |
0.3054 times |
Fri 17 January 2025 |
915.00 (-5.18%) |
915.00 |
915.00 - 915.00 |
0.0193 times |
Tue 10 December 2024 |
965.00 (0%) |
965.00 |
965.00 - 965.00 |
0.0387 times |
Thu 28 November 2024 |
965.00 (1.57%) |
949.90 |
949.90 - 965.00 |
0.5025 times |
Tue 15 October 2024 |
950.05 (0.53%) |
936.00 |
935.63 - 959.40 |
0.5953 times |
Mon 30 September 2024 |
945.00 (-1.79%) |
971.10 |
901.80 - 1099.10 |
3.591 times |

DMA SMA EMA moving averages of Sec Re 1075SCL33A_N2
DMA (daily moving average) of Sec Re 1075SCL33A_N2
| DMA period | DMA value | | 5 day DMA | 955.6 | | 12 day DMA | 940.33 | | 20 day DMA | 940.7 | | 35 day DMA | 943.24 | | 50 day DMA | | | 100 day DMA | | | 150 day DMA | | | 200 day DMA | | EMA (exponential moving average) of Sec Re 1075SCL33A_N2
| EMA period | EMA current | EMA prev | EMA prev2 | | 5 day EMA | 961.96 | 943.95 | 925.93 | | 12 day EMA | 946.53 | 937.17 | 929.38 | | 20 day EMA | 946.37 | 940.94 | 936.83 | | 35 day EMA | 955.95 | 953.47 | 951.91 | | 50 day EMA | 0 | 0 | 0 |
SMA (simple moving average) of Sec Re 1075SCL33A_N2
| SMA period | SMA current | SMA prev | SMA prev2 | | 5 day SMA | 955.6 | 936 | 920 | | 12 day SMA | 940.33 | 933.83 | 928.83 | | 20 day SMA | 940.7 | 939.05 | 938.3 | | 35 day SMA | 943.24 | 941.87 | 945.27 | | 50 day SMA | | 100 day SMA | | 150 day SMA | | 200 day SMA |
|
|
