SecRed 1060ECL29_NS full analysis,charts,indicators,moving averages,SMA,DMA,EMA,ADX,MACD,RSISec Red 1060ECL29_NS WideScreen charts, DMA,SMA,EMA technical analysis, forecast prediction, by indicators ADX,MACD,RSI,CCI NSE stock exchange
Daily price and charts and targets SecRed Strong Daily Stock price targets for SecRed 1060ECL29_NS are 1077.5 and 1084 | Daily Target 1 | 1076.33 | | Daily Target 2 | 1078.67 | | Daily Target 3 | 1082.8333333333 | | Daily Target 4 | 1085.17 | | Daily Target 5 | 1089.33 |
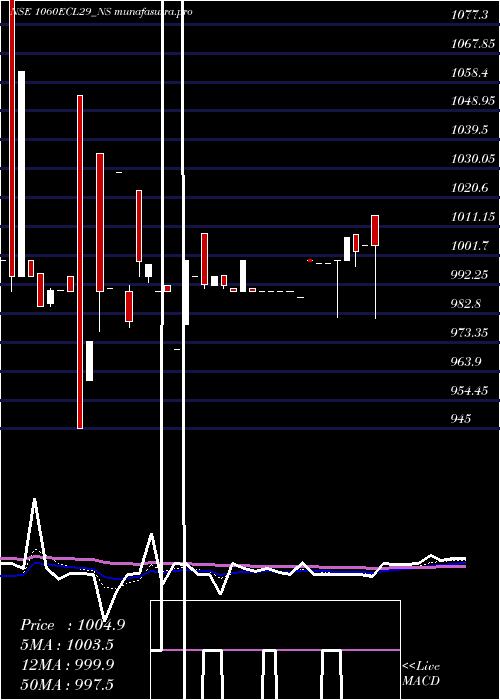
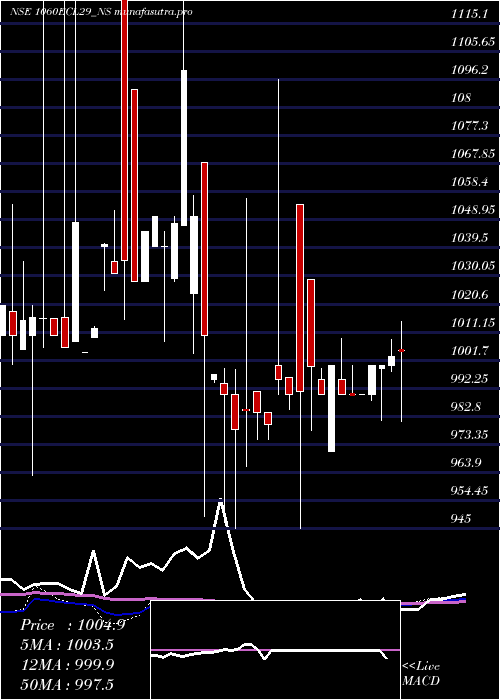
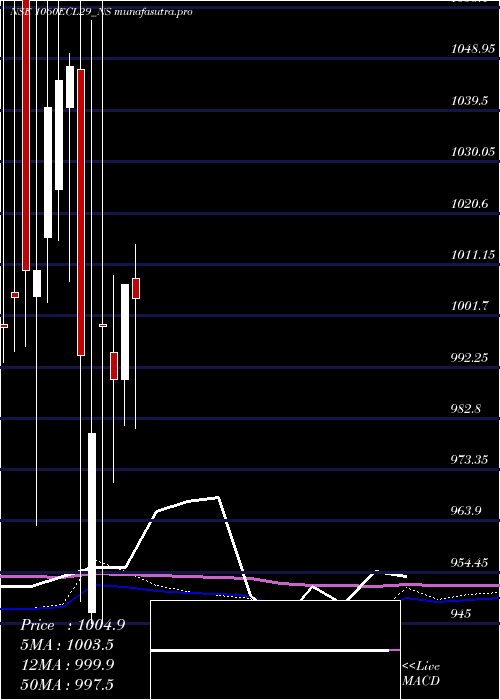
Daily price and volume Sec Red
| Date |
Closing |
Open |
Range |
Volume |
Tue 09 December 2025 |
1081.00 (0.56%) |
1082.01 |
1080.50 - 1087.00 |
1.6832 times |
Mon 08 December 2025 |
1075.00 (-1.01%) |
1087.00 |
1062.00 - 1087.00 |
1.8604 times |
Fri 05 December 2025 |
1086.00 (-0.09%) |
1090.00 |
1086.00 - 1090.00 |
1.2155 times |
Thu 04 December 2025 |
1087.00 (-0.37%) |
1084.00 |
1084.00 - 1090.00 |
0.567 times |
Wed 03 December 2025 |
1091.06 (0.1%) |
1089.90 |
1086.50 - 1093.00 |
1.9313 times |
Tue 02 December 2025 |
1090.00 (0.83%) |
1139.00 |
1086.00 - 1139.00 |
0.5315 times |
Mon 01 December 2025 |
1081.01 (-0.14%) |
1081.01 |
1081.01 - 1081.01 |
0.1417 times |
Fri 28 November 2025 |
1082.48 (1.93%) |
1079.00 |
1079.00 - 1085.00 |
1.0418 times |
Thu 27 November 2025 |
1062.00 (-1.67%) |
1034.00 |
1034.00 - 1062.00 |
0.567 times |
Wed 26 November 2025 |
1080.00 (-5.18%) |
1033.00 |
1033.00 - 1081.00 |
0.4607 times |
Tue 25 November 2025 |
1139.00 (5.37%) |
1139.00 |
1139.00 - 1139.00 |
0.1063 times |
Weekly price and charts SecRed Strong weekly Stock price targets for SecRed 1060ECL29_NS are 1059 and 1084 | Weekly Target 1 | 1051.67 | | Weekly Target 2 | 1066.33 | | Weekly Target 3 | 1076.6666666667 | | Weekly Target 4 | 1091.33 | | Weekly Target 5 | 1101.67 |
Weekly price and volumes for Sec Red
| Date |
Closing |
Open |
Range |
Volume |
Tue 09 December 2025 |
1081.00 (-0.46%) |
1087.00 |
1062.00 - 1087.00 |
1.1513 times |
Fri 05 December 2025 |
1086.00 (0.33%) |
1081.01 |
1081.01 - 1139.00 |
1.4253 times |
Fri 28 November 2025 |
1082.48 (0.23%) |
1075.00 |
1033.00 - 1139.00 |
0.7414 times |
Thu 20 November 2025 |
1080.00 (-1.73%) |
1071.00 |
1071.00 - 1140.00 |
2.4108 times |
Fri 14 November 2025 |
1099.00 (2.6%) |
1085.00 |
1085.00 - 1148.00 |
0.3327 times |
Fri 07 November 2025 |
1071.10 (1.05%) |
1072.00 |
1071.00 - 1072.00 |
0.0345 times |
Fri 31 October 2025 |
1060.00 (3.31%) |
1178.00 |
1060.00 - 1178.00 |
1.3528 times |
Fri 17 October 2025 |
1026.00 (-2.89%) |
1188.00 |
1026.00 - 1188.00 |
1.3988 times |
Fri 10 October 2025 |
1056.50 (-14.18%) |
1220.00 |
1050.00 - 1220.00 |
0.7668 times |
Wed 01 October 2025 |
1231.00 (17.17%) |
1014.00 |
1014.00 - 1231.00 |
0.3857 times |
Fri 26 September 2025 |
1050.60 (-0.13%) |
1068.90 |
1050.60 - 1068.99 |
0.5215 times |
Monthly price and charts SecRed Strong monthly Stock price targets for SecRed 1060ECL29_NS are 1033 and 1110 | Monthly Target 1 | 1017 | | Monthly Target 2 | 1049 | | Monthly Target 3 | 1094 | | Monthly Target 4 | 1126 | | Monthly Target 5 | 1171 |
Monthly price and volumes Sec Red
| Date |
Closing |
Open |
Range |
Volume |
Tue 09 December 2025 |
1081.00 (-0.14%) |
1081.01 |
1062.00 - 1139.00 |
0.8405 times |
Fri 28 November 2025 |
1082.48 (2.12%) |
1072.00 |
1033.00 - 1148.00 |
1.1481 times |
Fri 31 October 2025 |
1060.00 (-0.47%) |
1231.00 |
1026.00 - 1231.00 |
1.1853 times |
Tue 30 September 2025 |
1065.00 (0.95%) |
1056.60 |
1008.00 - 1108.00 |
0.5889 times |
Thu 28 August 2025 |
1055.00 (0%) |
1005.60 |
1005.60 - 1188.00 |
1.0546 times |
Mon 28 July 2025 |
1055.00 (0.45%) |
1040.50 |
1040.00 - 1246.00 |
1.1154 times |
Mon 30 June 2025 |
1050.24 (-6.06%) |
1340.00 |
890.30 - 1340.00 |
2.3056 times |
Fri 30 May 2025 |
1118.00 (10.97%) |
1008.50 |
951.10 - 1148.00 |
0.9618 times |
Mon 28 April 2025 |
1007.50 (1.77%) |
990.00 |
981.50 - 1007.50 |
0.3331 times |
Fri 28 March 2025 |
990.00 (-0.97%) |
995.00 |
971.00 - 1009.00 |
0.4668 times |
Fri 28 February 2025 |
999.69 (2.01%) |
999.99 |
945.00 - 1096.00 |
1.2514 times |
DMA SMA EMA moving averages of Sec Red 1060ECL29_NS
DMA (daily moving average) of Sec Red 1060ECL29_NS
| DMA period | DMA value | | 5 day DMA | 1084.01 | | 12 day DMA | 1086.3 | | 20 day DMA | 1091.53 | | 35 day DMA | 1093.41 | | 50 day DMA | 1082.58 | | 100 day DMA | 1064.72 | | 150 day DMA | 1040.78 | | 200 day DMA | 1037.05 | EMA (exponential moving average) of Sec Red 1060ECL29_NS
| EMA period | EMA current | EMA prev | EMA prev2 | | 5 day EMA | 1082.33 | 1082.99 | 1086.99 | | 12 day EMA | 1085.67 | 1086.52 | 1088.61 | | 20 day EMA | 1086.79 | 1087.4 | 1088.71 | | 35 day EMA | 1084.4 | 1084.6 | 1085.17 | | 50 day EMA | 1080.33 | 1080.3 | 1080.52 |
SMA (simple moving average) of Sec Red 1060ECL29_NS
| SMA period | SMA current | SMA prev | SMA prev2 | | 5 day SMA | 1084.01 | 1085.81 | 1087.01 | | 12 day SMA | 1086.3 | 1086.21 | 1090.55 | | 20 day SMA | 1091.53 | 1090.48 | 1090.18 | | 35 day SMA | 1093.41 | 1092.98 | 1092.29 | | 50 day SMA | 1082.58 | 1082 | 1081.5 | | 100 day SMA | 1064.72 | 1064.01 | 1063.31 | | 150 day SMA | 1040.78 | 1040.13 | 1039.53 | | 200 day SMA | 1037.05 | 1036.82 | 1036.62 |
|
|
