GoiLoan 1018GS2026_GS full analysis,charts,indicators,moving averages,SMA,DMA,EMA,ADX,MACD,RSIGoi Loan 1018GS2026_GS WideScreen charts, DMA,SMA,EMA technical analysis, forecast prediction, by indicators ADX,MACD,RSI,CCI NSE stock exchange
Daily price and charts and targets GoiLoan Strong Daily Stock price targets for GoiLoan 1018GS2026_GS are 104.63 and 105.88 | Daily Target 1 | 103.58 | | Daily Target 2 | 104.42 | | Daily Target 3 | 104.83333333333 | | Daily Target 4 | 105.67 | | Daily Target 5 | 106.08 |
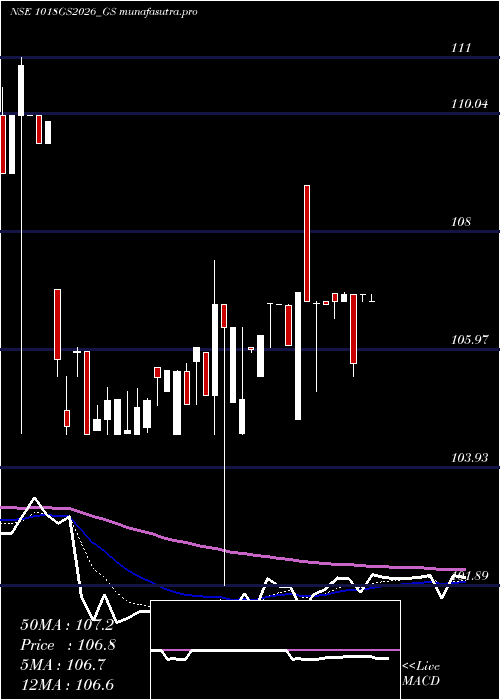
Daily price and volume Goi Loan
| Date |
Closing |
Open |
Range |
Volume |
Thu 30 October 2025 |
105.25 (1.2%) |
104.00 |
104.00 - 105.25 |
0.0219 times |
Wed 29 October 2025 |
104.00 (-1.05%) |
106.50 |
104.00 - 106.50 |
0.1421 times |
Tue 28 October 2025 |
105.10 (-0.13%) |
104.10 |
104.10 - 105.10 |
0.0045 times |
Mon 27 October 2025 |
105.24 (-0.72%) |
106.50 |
103.00 - 106.50 |
1.0003 times |
Fri 24 October 2025 |
106.00 (0.19%) |
106.00 |
106.00 - 106.00 |
0.0068 times |
Thu 23 October 2025 |
105.80 (-0.18%) |
105.90 |
104.26 - 105.90 |
1.3184 times |
Tue 21 October 2025 |
105.99 (0%) |
105.99 |
105.99 - 105.99 |
1.0082 times |
Mon 20 October 2025 |
105.99 (2.46%) |
103.45 |
103.45 - 107.00 |
3.9546 times |
Fri 17 October 2025 |
103.45 (-2.41%) |
103.35 |
103.35 - 107.00 |
0.1957 times |
Thu 16 October 2025 |
106.00 (0%) |
108.50 |
104.00 - 108.50 |
2.3474 times |
Wed 15 October 2025 |
106.00 (0.42%) |
103.45 |
103.45 - 109.00 |
0.006 times |
Weekly price and charts GoiLoan Strong weekly Stock price targets for GoiLoan 1018GS2026_GS are 102.38 and 105.88 | Weekly Target 1 | 101.42 | | Weekly Target 2 | 103.33 | | Weekly Target 3 | 104.91666666667 | | Weekly Target 4 | 106.83 | | Weekly Target 5 | 108.42 |
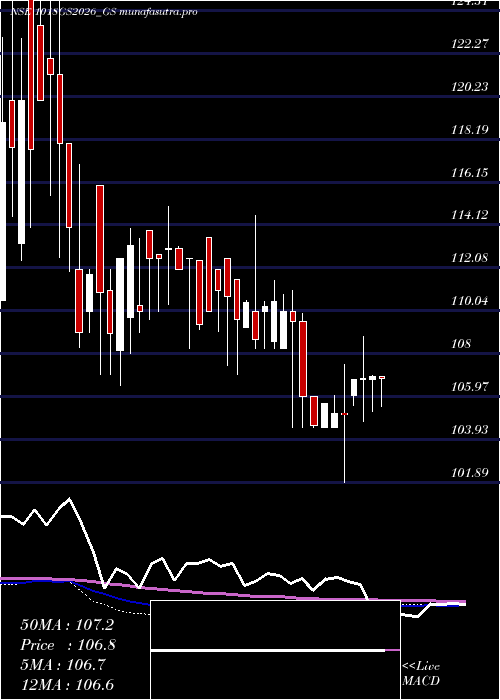
Weekly price and volumes for Goi Loan
| Date |
Closing |
Open |
Range |
Volume |
Thu 30 October 2025 |
105.25 (-0.71%) |
106.50 |
103.00 - 106.50 |
0.2906 times |
Fri 24 October 2025 |
106.00 (2.46%) |
103.45 |
103.45 - 107.00 |
1.5633 times |
Fri 17 October 2025 |
103.45 (-1.94%) |
104.73 |
103.35 - 109.00 |
0.9355 times |
Fri 10 October 2025 |
105.50 (-2.31%) |
103.45 |
103.45 - 106.00 |
0.735 times |
Fri 03 October 2025 |
108.00 (2.33%) |
103.43 |
103.25 - 110.81 |
1.0772 times |
Fri 26 September 2025 |
105.54 (0.04%) |
102.86 |
102.86 - 106.00 |
1.0068 times |
Fri 19 September 2025 |
105.50 (-1.95%) |
104.91 |
103.25 - 109.00 |
1.3528 times |
Fri 12 September 2025 |
107.60 (-3.84%) |
111.40 |
104.50 - 111.40 |
0.5277 times |
Fri 05 September 2025 |
111.90 (1.31%) |
109.50 |
107.95 - 111.90 |
0.7234 times |
Fri 29 August 2025 |
110.45 (0.87%) |
109.25 |
107.25 - 111.80 |
1.7876 times |
Fri 22 August 2025 |
109.50 (0.98%) |
108.44 |
108.44 - 109.50 |
0.164 times |
Monthly price and charts GoiLoan Strong monthly Stock price targets for GoiLoan 1018GS2026_GS are 104.13 and 110.13 | Monthly Target 1 | 99.75 | | Monthly Target 2 | 102.5 | | Monthly Target 3 | 105.75 | | Monthly Target 4 | 108.5 | | Monthly Target 5 | 111.75 |
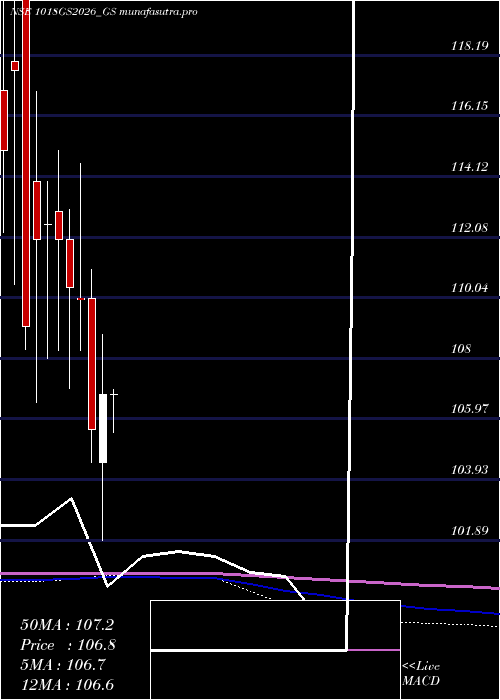
Monthly price and volumes Goi Loan
| Date |
Closing |
Open |
Range |
Volume |
Thu 30 October 2025 |
105.25 (1.2%) |
104.05 |
103.00 - 109.00 |
0.6304 times |
Tue 30 September 2025 |
104.00 (-5.84%) |
109.50 |
102.86 - 111.90 |
0.6334 times |
Fri 29 August 2025 |
110.45 (2.03%) |
108.50 |
107.00 - 113.00 |
1.4386 times |
Thu 31 July 2025 |
108.25 (0.09%) |
108.35 |
105.49 - 108.70 |
0.6774 times |
Mon 30 June 2025 |
108.15 (-1.68%) |
106.20 |
106.00 - 109.99 |
0.4227 times |
Fri 30 May 2025 |
110.00 (3%) |
106.79 |
104.13 - 111.74 |
2.4284 times |
Wed 30 April 2025 |
106.80 (1.14%) |
104.50 |
101.89 - 108.80 |
0.8829 times |
Fri 28 March 2025 |
105.60 (-3.98%) |
110.00 |
104.50 - 111.00 |
1.9236 times |
Fri 28 February 2025 |
109.98 (-0.38%) |
110.00 |
108.25 - 114.55 |
0.4225 times |
Fri 31 January 2025 |
110.40 (-1.43%) |
112.00 |
107.00 - 113.00 |
0.5401 times |
Tue 31 December 2024 |
112.00 (-0.44%) |
112.95 |
108.25 - 115.00 |
1.573 times |
DMA SMA EMA moving averages of Goi Loan 1018GS2026_GS
DMA (daily moving average) of Goi Loan 1018GS2026_GS
| DMA period | DMA value | | 5 day DMA | 105.12 | | 12 day DMA | 105.37 | | 20 day DMA | 105.35 | | 35 day DMA | 105.65 | | 50 day DMA | 106.83 | | 100 day DMA | 107.65 | | 150 day DMA | 107.39 | | 200 day DMA | 108.16 | EMA (exponential moving average) of Goi Loan 1018GS2026_GS
| EMA period | EMA current | EMA prev | EMA prev2 | | 5 day EMA | 105.05 | 104.95 | 105.42 | | 12 day EMA | 105.24 | 105.24 | 105.47 | | 20 day EMA | 105.45 | 105.47 | 105.62 | | 35 day EMA | 106.23 | 106.29 | 106.43 | | 50 day EMA | 106.96 | 107.03 | 107.15 |
SMA (simple moving average) of Goi Loan 1018GS2026_GS
| SMA period | SMA current | SMA prev | SMA prev2 | | 5 day SMA | 105.12 | 105.23 | 105.63 | | 12 day SMA | 105.37 | 105.39 | 105.52 | | 20 day SMA | 105.35 | 105.29 | 105.25 | | 35 day SMA | 105.65 | 105.82 | 106.04 | | 50 day SMA | 106.83 | 106.9 | 107 | | 100 day SMA | 107.65 | 107.69 | 107.75 | | 150 day SMA | 107.39 | 107.42 | 107.47 | | 200 day SMA | 108.16 | 108.2 | 108.24 |
|
|
