SecRe 0MOFSL26_N1 full analysis,charts,indicators,moving averages,SMA,DMA,EMA,ADX,MACD,RSISec Re 0MOFSL26_N1 WideScreen charts, DMA,SMA,EMA technical analysis, forecast prediction, by indicators ADX,MACD,RSI,CCI NSE stock exchange
Daily price and charts and targets SecRe Strong Daily Stock price targets for SecRe 0MOFSL26_N1 are 1129.75 and 1130.25 | Daily Target 1 | 1129.33 | | Daily Target 2 | 1129.67 | | Daily Target 3 | 1129.8333333333 | | Daily Target 4 | 1130.17 | | Daily Target 5 | 1130.33 |
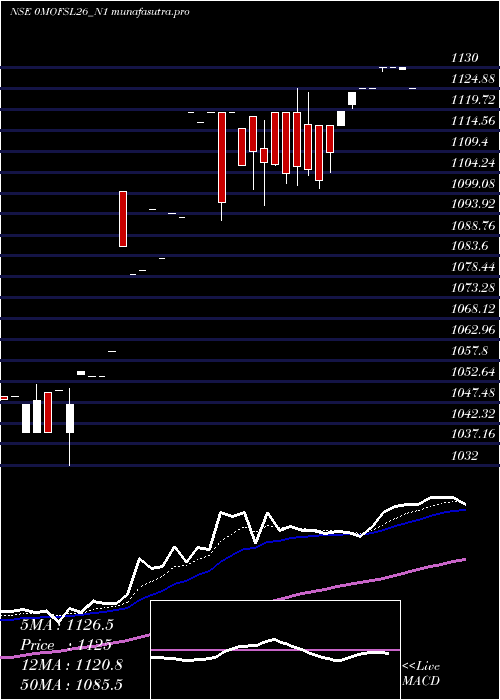
Daily price and volume Sec Re
| Date |
Closing |
Open |
Range |
Volume |
Wed 29 October 2025 |
1130.00 (0%) |
1129.50 |
1129.50 - 1130.00 |
0.004 times |
Tue 28 October 2025 |
1130.00 (0%) |
1130.00 |
1130.00 - 1130.00 |
0.0032 times |
Fri 24 October 2025 |
1130.00 (0.44%) |
1130.00 |
1129.00 - 1130.00 |
0.0434 times |
Wed 15 October 2025 |
1125.00 (0%) |
1125.00 |
1125.00 - 1125.00 |
0.0056 times |
Mon 13 October 2025 |
1125.00 (0.1%) |
1125.00 |
1125.00 - 1125.00 |
0.0024 times |
Tue 07 October 2025 |
1123.90 (0.42%) |
1121.00 |
1120.00 - 1123.90 |
0.2192 times |
Mon 06 October 2025 |
1119.23 (0.91%) |
1115.80 |
1115.80 - 1119.23 |
0.1331 times |
Fri 03 October 2025 |
1109.09 (0.63%) |
1115.80 |
1104.20 - 1115.80 |
5.6981 times |
Wed 01 October 2025 |
1102.17 (-0.24%) |
1115.80 |
1100.25 - 1115.81 |
3.0483 times |
Tue 30 September 2025 |
1104.81 (-0.08%) |
1116.00 |
1103.55 - 1124.00 |
0.8426 times |
Mon 29 September 2025 |
1105.64 (0.14%) |
1119.00 |
1101.00 - 1125.00 |
3.5011 times |
Weekly price and charts SecRe Strong weekly Stock price targets for SecRe 0MOFSL26_N1 are 1129.75 and 1130.25 | Weekly Target 1 | 1129.33 | | Weekly Target 2 | 1129.67 | | Weekly Target 3 | 1129.8333333333 | | Weekly Target 4 | 1130.17 | | Weekly Target 5 | 1130.33 |
Weekly price and volumes for Sec Re
| Date |
Closing |
Open |
Range |
Volume |
Wed 29 October 2025 |
1130.00 (0%) |
1130.00 |
1129.50 - 1130.00 |
0.0045 times |
Fri 24 October 2025 |
1130.00 (0.54%) |
1125.00 |
1125.00 - 1130.00 |
0.0326 times |
Tue 07 October 2025 |
1123.90 (1.34%) |
1115.80 |
1115.80 - 1123.90 |
0.2233 times |
Fri 03 October 2025 |
1109.09 (0.45%) |
1119.00 |
1100.25 - 1125.00 |
8.2964 times |
Fri 26 September 2025 |
1104.09 (-0.17%) |
1118.00 |
1096.00 - 1119.00 |
1.2823 times |
Fri 19 September 2025 |
1106.00 (-1.16%) |
1119.00 |
1092.30 - 1119.00 |
0.098 times |
Wed 10 September 2025 |
1119.00 (0.23%) |
1119.00 |
1119.00 - 1119.00 |
0.0505 times |
Fri 05 September 2025 |
1116.38 (3.08%) |
1094.00 |
1093.00 - 1119.00 |
0.0093 times |
Thu 03 July 2025 |
1083.00 (-1.1%) |
1083.00 |
1083.00 - 1083.00 |
0.0025 times |
Fri 20 June 2025 |
1095.00 (1.39%) |
1095.00 |
1095.00 - 1095.00 |
0.0005 times |
Fri 13 June 2025 |
1080.01 (-0.55%) |
1079.00 |
1079.00 - 1080.01 |
0.0071 times |

Monthly price and charts SecRe Strong monthly Stock price targets for SecRe 0MOFSL26_N1 are 1115.13 and 1144.88 | Monthly Target 1 | 1090.33 | | Monthly Target 2 | 1110.17 | | Monthly Target 3 | 1120.0833333333 | | Monthly Target 4 | 1139.92 | | Monthly Target 5 | 1149.83 |
Monthly price and volumes Sec Re
| Date |
Closing |
Open |
Range |
Volume |
Wed 29 October 2025 |
1130.00 (2.28%) |
1115.80 |
1100.25 - 1130.00 |
4.7773 times |
Tue 30 September 2025 |
1104.81 (-1.27%) |
1116.38 |
1092.30 - 1125.00 |
3.4446 times |
Wed 20 August 2025 |
1119.00 (2.29%) |
1093.00 |
1093.00 - 1119.00 |
0.0006 times |
Mon 14 July 2025 |
1094.00 (-0.09%) |
1083.00 |
1083.00 - 1094.00 |
0.0083 times |
Fri 20 June 2025 |
1095.00 (1.48%) |
1080.01 |
1080.01 - 1095.00 |
0.0033 times |
Mon 19 May 2025 |
1079.00 (2.39%) |
1060.00 |
1060.00 - 1099.50 |
0.0175 times |
Mon 24 March 2025 |
1053.80 (0%) |
1053.80 |
1053.80 - 1053.80 |
0.0021 times |
Wed 19 February 2025 |
1053.80 (0.46%) |
1040.00 |
1032.00 - 1055.00 |
0.7457 times |
Tue 28 January 2025 |
1049.00 (0.88%) |
1035.00 |
1035.00 - 1049.00 |
0.6974 times |
Tue 31 December 2024 |
1039.80 (0.8%) |
1074.80 |
1015.20 - 1074.80 |
0.3032 times |
Mon 25 November 2024 |
1031.50 (3.15%) |
1074.80 |
1003.01 - 1074.80 |
0.0385 times |

DMA SMA EMA moving averages of Sec Re 0MOFSL26_N1
DMA (daily moving average) of Sec Re 0MOFSL26_N1
| DMA period | DMA value | | 5 day DMA | 1128 | | 12 day DMA | 1117.41 | | 20 day DMA | 1114.41 | | 35 day DMA | 1096.49 | | 50 day DMA | 1080.42 | | 100 day DMA | | | 150 day DMA | | | 200 day DMA | | EMA (exponential moving average) of Sec Re 0MOFSL26_N1
| EMA period | EMA current | EMA prev | EMA prev2 | | 5 day EMA | 1127.19 | 1125.79 | 1123.68 | | 12 day EMA | 1120.04 | 1118.23 | 1116.09 | | 20 day EMA | 1112.34 | 1110.48 | 1108.43 | | 35 day EMA | 1096.81 | 1094.86 | 1092.79 | | 50 day EMA | 1081.25 | 1079.26 | 1077.19 |
SMA (simple moving average) of Sec Re 0MOFSL26_N1
| SMA period | SMA current | SMA prev | SMA prev2 | | 5 day SMA | 1128 | 1126.78 | 1124.63 | | 12 day SMA | 1117.41 | 1115.42 | 1113.47 | | 20 day SMA | 1114.41 | 1113.86 | 1112.01 | | 35 day SMA | 1096.49 | 1094.15 | 1091.78 | | 50 day SMA | 1080.42 | 1078.59 | 1076.37 | | 100 day SMA | | 150 day SMA | | 200 day SMA |
|
|
