ZkInternational ZKIN full analysis,charts,indicators,moving averages,SMA,DMA,EMA,ADX,MACD,RSIZk International ZKIN WideScreen charts, DMA,SMA,EMA technical analysis, forecast prediction, by indicators ADX,MACD,RSI,CCI NASDAQ stock exchange
operates under Capital Goods sector & deals in Metal Fabrications
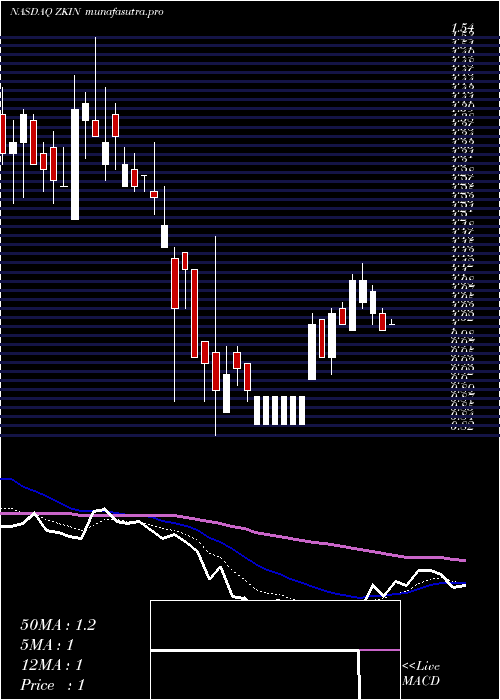
Daily price and charts and targets ZkInternational Strong Daily Stock price targets for ZkInternational ZKIN are 1.95 and 2.13 | Daily Target 1 | 1.8 | | Daily Target 2 | 1.91 | | Daily Target 3 | 1.9766666666667 | | Daily Target 4 | 2.09 | | Daily Target 5 | 2.16 |
Daily price and volume Zk International
| Date |
Closing |
Open |
Range |
Volume |
Mon 14 July 2025 |
2.03 (5.73%) |
1.87 |
1.86 - 2.04 |
0.6784 times |
Fri 11 July 2025 |
1.92 (-3.52%) |
1.94 |
1.88 - 2.06 |
1.3985 times |
Thu 10 July 2025 |
1.99 (1.02%) |
1.97 |
1.90 - 2.05 |
0.3847 times |
Wed 09 July 2025 |
1.97 (-4.83%) |
2.01 |
1.89 - 2.06 |
0.7187 times |
Tue 08 July 2025 |
2.07 (0.98%) |
2.02 |
1.98 - 2.19 |
2.6838 times |
Mon 07 July 2025 |
2.05 (-5.96%) |
2.02 |
1.99 - 2.37 |
1.1153 times |
Thu 03 July 2025 |
2.18 (2.35%) |
2.24 |
2.08 - 2.28 |
1.0004 times |
Wed 02 July 2025 |
2.13 (5.45%) |
2.03 |
2.02 - 2.34 |
1.7295 times |
Tue 01 July 2025 |
2.02 (-1.94%) |
2.02 |
2.02 - 2.08 |
0.0969 times |
Mon 30 June 2025 |
2.06 (5.64%) |
1.96 |
1.94 - 2.06 |
0.1938 times |
Fri 27 June 2025 |
1.95 (-3.94%) |
2.03 |
1.90 - 2.06 |
0.1789 times |
Weekly price and charts ZkInternational Strong weekly Stock price targets for ZkInternational ZKIN are 1.95 and 2.13 | Weekly Target 1 | 1.8 | | Weekly Target 2 | 1.91 | | Weekly Target 3 | 1.9766666666667 | | Weekly Target 4 | 2.09 | | Weekly Target 5 | 2.16 |
Weekly price and volumes for Zk International
| Date |
Closing |
Open |
Range |
Volume |
Mon 14 July 2025 |
2.03 (5.73%) |
1.87 |
1.86 - 2.04 |
0.0541 times |
Fri 11 July 2025 |
1.92 (-11.93%) |
2.02 |
1.88 - 2.37 |
0.5021 times |
Thu 03 July 2025 |
2.18 (11.79%) |
1.96 |
1.94 - 2.34 |
0.2407 times |
Fri 27 June 2025 |
1.95 (-11.76%) |
2.17 |
1.85 - 2.22 |
0.1347 times |
Fri 20 June 2025 |
2.21 (-2.64%) |
2.35 |
2.17 - 2.35 |
0.0771 times |
Fri 13 June 2025 |
2.27 (-2.99%) |
2.28 |
2.26 - 2.71 |
0.2481 times |
Fri 06 June 2025 |
2.34 (-2.9%) |
2.47 |
2.21 - 2.47 |
0.2427 times |
Fri 30 May 2025 |
2.41 (-12.36%) |
2.68 |
2.12 - 2.85 |
0.3615 times |
Fri 23 May 2025 |
2.75 (-4.84%) |
2.80 |
2.46 - 3.89 |
3.2704 times |
Fri 16 May 2025 |
2.89 (-27.57%) |
3.37 |
2.22 - 3.59 |
4.8686 times |
Fri 09 May 2025 |
3.99 (291.18%) |
1.10 |
1.01 - 4.47 |
166.616 times |
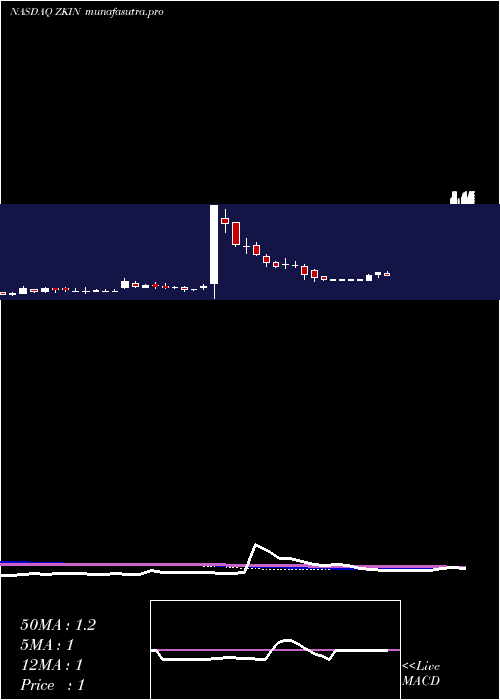
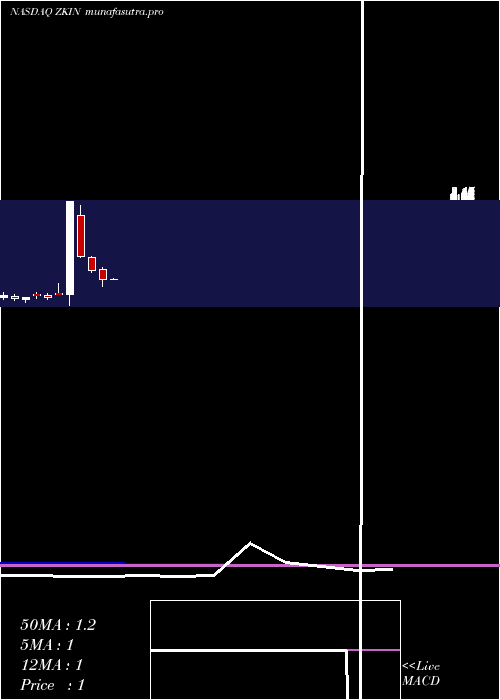
Monthly price and charts ZkInternational Strong monthly Stock price targets for ZkInternational ZKIN are 1.95 and 2.46 | Monthly Target 1 | 1.58 | | Monthly Target 2 | 1.8 | | Monthly Target 3 | 2.0866666666667 | | Monthly Target 4 | 2.31 | | Monthly Target 5 | 2.6 |
Monthly price and volumes Zk International
| Date |
Closing |
Open |
Range |
Volume |
Mon 14 July 2025 |
2.03 (-1.46%) |
2.02 |
1.86 - 2.37 |
0.0315 times |
Mon 30 June 2025 |
2.06 (-14.52%) |
2.47 |
1.85 - 2.71 |
0.029 times |
Fri 30 May 2025 |
2.41 (138.61%) |
1.02 |
1.01 - 4.47 |
7.0691 times |
Wed 30 April 2025 |
1.01 (-20.47%) |
1.29 |
0.82 - 1.35 |
0.0198 times |
Mon 31 March 2025 |
1.27 (-23.03%) |
1.61 |
1.21 - 1.65 |
0.0237 times |
Fri 28 February 2025 |
1.65 (-48.11%) |
2.79 |
1.63 - 3.07 |
0.0485 times |
Fri 31 January 2025 |
3.18 (430%) |
0.60 |
0.29 - 3.18 |
1.9924 times |
Tue 31 December 2024 |
0.60 (15.38%) |
0.63 |
0.60 - 0.90 |
0.0671 times |
Tue 26 November 2024 |
0.52 (-8.77%) |
0.56 |
0.46 - 0.63 |
0.0873 times |
Thu 31 October 2024 |
0.57 (11.76%) |
0.58 |
0.48 - 0.65 |
0.6316 times |
Mon 30 September 2024 |
0.51 (8.51%) |
0.46 |
0.38 - 0.51 |
0.3797 times |
DMA SMA EMA moving averages of Zk International ZKIN
DMA (daily moving average) of Zk International ZKIN
| DMA period | DMA value | | 5 day DMA | 2 | | 12 day DMA | 2.03 | | 20 day DMA | 2.1 | | 35 day DMA | 2.26 | | 50 day DMA | 2.27 | | 100 day DMA | 1.77 | | 150 day DMA | 1.54 | | 200 day DMA | 1.29 | EMA (exponential moving average) of Zk International ZKIN
| EMA period | EMA current | EMA prev | EMA prev2 | | 5 day EMA | 2 | 1.99 | 2.02 | | 12 day EMA | 2.05 | 2.05 | 2.07 | | 20 day EMA | 2.08 | 2.09 | 2.11 | | 35 day EMA | 2.1 | 2.1 | 2.11 | | 50 day EMA | 2.14 | 2.14 | 2.15 |
SMA (simple moving average) of Zk International ZKIN
| SMA period | SMA current | SMA prev | SMA prev2 | | 5 day SMA | 2 | 2 | 2.05 | | 12 day SMA | 2.03 | 2.03 | 2.04 | | 20 day SMA | 2.1 | 2.12 | 2.15 | | 35 day SMA | 2.26 | 2.3 | 2.35 | | 50 day SMA | 2.27 | 2.25 | 2.23 | | 100 day SMA | 1.77 | 1.77 | 1.77 | | 150 day SMA | 1.54 | 1.53 | 1.52 | | 200 day SMA | 1.29 | 1.28 | 1.27 |
|
|
