ExagenInc XGN full analysis,charts,indicators,moving averages,SMA,DMA,EMA,ADX,MACD,RSIExagen Inc XGN WideScreen charts, DMA,SMA,EMA technical analysis, forecast prediction, by indicators ADX,MACD,RSI,CCI NASDAQ stock exchange
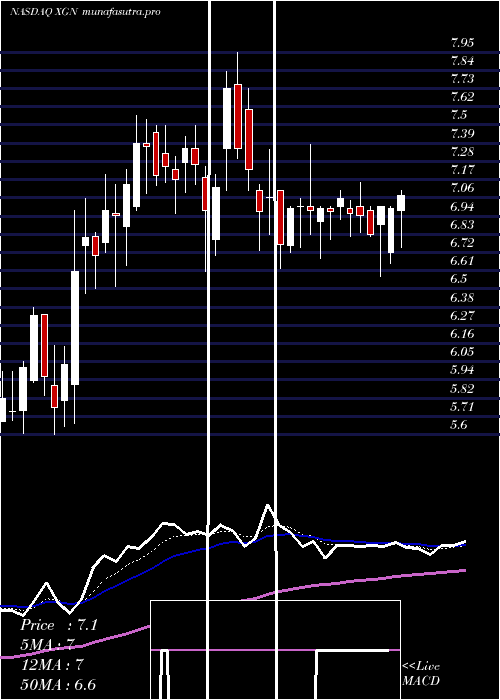
Daily price and charts and targets ExagenInc Strong Daily Stock price targets for ExagenInc XGN are 8.14 and 8.64 | Daily Target 1 | 8.05 | | Daily Target 2 | 8.22 | | Daily Target 3 | 8.5466666666667 | | Daily Target 4 | 8.72 | | Daily Target 5 | 9.05 |
Daily price and volume Exagen Inc
| Date |
Closing |
Open |
Range |
Volume |
Thu 31 July 2025 |
8.40 (-2.67%) |
8.78 |
8.37 - 8.87 |
0.8612 times |
Wed 30 July 2025 |
8.63 (2.13%) |
8.81 |
8.63 - 9.10 |
1.6818 times |
Tue 29 July 2025 |
8.45 (14.34%) |
7.97 |
7.70 - 8.80 |
3.6608 times |
Mon 28 July 2025 |
7.39 (1.65%) |
7.30 |
7.12 - 7.45 |
0.4034 times |
Fri 25 July 2025 |
7.27 (0.69%) |
7.30 |
7.16 - 7.39 |
0.1588 times |
Thu 24 July 2025 |
7.22 (-1.37%) |
7.37 |
7.20 - 7.45 |
0.2657 times |
Wed 23 July 2025 |
7.32 (5.48%) |
7.30 |
7.22 - 7.50 |
2.0969 times |
Tue 22 July 2025 |
6.94 (-0.43%) |
7.01 |
6.81 - 7.10 |
0.3903 times |
Mon 21 July 2025 |
6.97 (-0.43%) |
7.05 |
6.93 - 7.20 |
0.2393 times |
Fri 18 July 2025 |
7.00 (-2.64%) |
7.29 |
6.82 - 7.29 |
0.2419 times |
Thu 17 July 2025 |
7.19 (2.71%) |
6.99 |
6.99 - 7.30 |
0.9898 times |
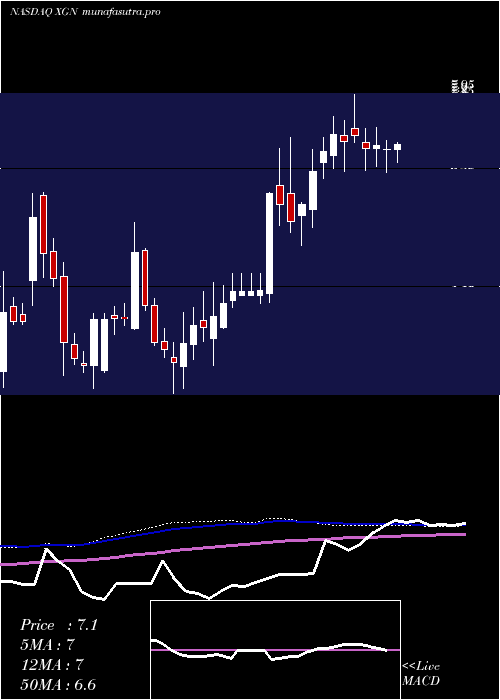
Weekly price and charts ExagenInc Strong weekly Stock price targets for ExagenInc XGN are 7.76 and 9.74 | Weekly Target 1 | 6.23 | | Weekly Target 2 | 7.31 | | Weekly Target 3 | 8.2066666666667 | | Weekly Target 4 | 9.29 | | Weekly Target 5 | 10.19 |
Weekly price and volumes for Exagen Inc
| Date |
Closing |
Open |
Range |
Volume |
Thu 31 July 2025 |
8.40 (15.54%) |
7.30 |
7.12 - 9.10 |
2.7911 times |
Fri 25 July 2025 |
7.27 (3.86%) |
7.05 |
6.81 - 7.50 |
1.3311 times |
Fri 18 July 2025 |
7.00 (0.14%) |
6.98 |
6.75 - 7.30 |
1.0577 times |
Fri 11 July 2025 |
6.99 (-0.85%) |
6.99 |
6.57 - 7.15 |
0.7861 times |
Thu 03 July 2025 |
7.05 (0.71%) |
7.00 |
6.68 - 7.38 |
0.4862 times |
Fri 27 June 2025 |
7.00 (-3.18%) |
7.10 |
6.62 - 7.35 |
0.9314 times |
Fri 20 June 2025 |
7.23 (1.54%) |
7.36 |
7.10 - 7.95 |
0.7633 times |
Fri 13 June 2025 |
7.12 (-1.79%) |
7.23 |
6.60 - 7.50 |
0.7178 times |
Fri 06 June 2025 |
7.25 (4.32%) |
6.88 |
6.64 - 7.56 |
0.5518 times |
Fri 30 May 2025 |
6.95 (5.3%) |
6.76 |
6.47 - 7.20 |
0.5835 times |
Fri 23 May 2025 |
6.60 (9.82%) |
5.93 |
5.60 - 6.98 |
1.1006 times |
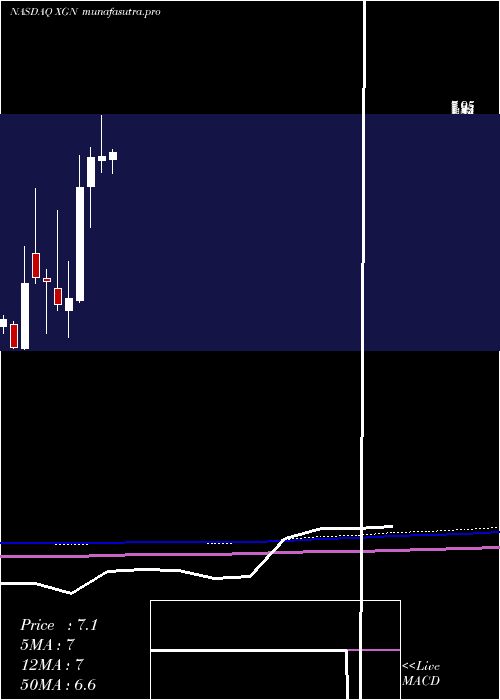
Monthly price and charts ExagenInc Strong monthly Stock price targets for ExagenInc XGN are 7.49 and 10.02 | Monthly Target 1 | 5.49 | | Monthly Target 2 | 6.95 | | Monthly Target 3 | 8.0233333333333 | | Monthly Target 4 | 9.48 | | Monthly Target 5 | 10.55 |
Monthly price and volumes Exagen Inc
| Date |
Closing |
Open |
Range |
Volume |
Thu 31 July 2025 |
8.40 (20.34%) |
6.91 |
6.57 - 9.10 |
2.3458 times |
Mon 30 June 2025 |
6.98 (0.43%) |
6.88 |
6.60 - 7.95 |
1.1334 times |
Fri 30 May 2025 |
6.95 (11.56%) |
6.27 |
5.29 - 7.20 |
1.9977 times |
Wed 30 April 2025 |
6.23 (73.54%) |
3.54 |
3.49 - 7.00 |
0.7119 times |
Mon 31 March 2025 |
3.59 (3.76%) |
3.31 |
2.67 - 4.48 |
0.4968 times |
Fri 28 February 2025 |
3.46 (-13.5%) |
3.82 |
3.31 - 5.70 |
0.7539 times |
Fri 31 January 2025 |
4.00 (-2.44%) |
4.07 |
2.76 - 4.28 |
1.2374 times |
Tue 31 December 2024 |
4.10 (4.06%) |
4.67 |
3.95 - 6.22 |
0.7971 times |
Tue 26 November 2024 |
3.94 (62.14%) |
2.39 |
2.38 - 4.83 |
0.4285 times |
Thu 31 October 2024 |
2.43 (-21.36%) |
2.97 |
2.40 - 3.04 |
0.0977 times |
Mon 30 September 2024 |
3.09 (3.69%) |
2.87 |
2.75 - 3.52 |
0.1931 times |
DMA SMA EMA moving averages of Exagen Inc XGN
DMA (daily moving average) of Exagen Inc XGN
| DMA period | DMA value | | 5 day DMA | 8.03 | | 12 day DMA | 7.48 | | 20 day DMA | 7.27 | | 35 day DMA | 7.21 | | 50 day DMA | 7.08 | | 100 day DMA | 5.9 | | 150 day DMA | 5.23 | | 200 day DMA | 4.79 | EMA (exponential moving average) of Exagen Inc XGN
| EMA period | EMA current | EMA prev | EMA prev2 | | 5 day EMA | 8.12 | 7.98 | 7.65 | | 12 day EMA | 7.67 | 7.54 | 7.34 | | 20 day EMA | 7.44 | 7.34 | 7.2 | | 35 day EMA | 7.21 | 7.14 | 7.05 | | 50 day EMA | 7.07 | 7.02 | 6.95 |
SMA (simple moving average) of Exagen Inc XGN
| SMA period | SMA current | SMA prev | SMA prev2 | | 5 day SMA | 8.03 | 7.79 | 7.53 | | 12 day SMA | 7.48 | 7.35 | 7.22 | | 20 day SMA | 7.27 | 7.2 | 7.12 | | 35 day SMA | 7.21 | 7.17 | 7.13 | | 50 day SMA | 7.08 | 7.03 | 6.97 | | 100 day SMA | 5.9 | 5.85 | 5.8 | | 150 day SMA | 5.23 | 5.21 | 5.19 | | 200 day SMA | 4.79 | 4.76 | 4.73 |
|
|
