XbiotechInc XBIT full analysis,charts,indicators,moving averages,SMA,DMA,EMA,ADX,MACD,RSIXbiotech Inc XBIT WideScreen charts, DMA,SMA,EMA technical analysis, forecast prediction, by indicators ADX,MACD,RSI,CCI NASDAQ stock exchange
operates under Health Care sector & deals in Major Pharmaceuticals
Daily price and charts and targets XbiotechInc Strong Daily Stock price targets for XbiotechInc XBIT are 2.31 and 2.58 | Daily Target 1 | 2.25 | | Daily Target 2 | 2.37 | | Daily Target 3 | 2.5233333333333 | | Daily Target 4 | 2.64 | | Daily Target 5 | 2.79 |
Daily price and volume Xbiotech Inc
| Date |
Closing |
Open |
Range |
Volume |
Fri 05 December 2025 |
2.48 (-1.2%) |
2.52 |
2.41 - 2.68 |
1.2677 times |
Thu 04 December 2025 |
2.51 (-3.09%) |
2.59 |
2.44 - 2.59 |
0.6404 times |
Wed 03 December 2025 |
2.59 (11.64%) |
2.35 |
2.35 - 2.59 |
1.7131 times |
Tue 02 December 2025 |
2.32 (-3.73%) |
2.38 |
2.30 - 2.40 |
0.7001 times |
Mon 01 December 2025 |
2.41 (6.17%) |
2.40 |
2.26 - 2.44 |
2.1774 times |
Fri 28 November 2025 |
2.27 (-0.44%) |
2.30 |
2.26 - 2.34 |
0.3391 times |
Wed 26 November 2025 |
2.28 (-2.98%) |
2.37 |
2.26 - 2.37 |
1.0232 times |
Tue 25 November 2025 |
2.35 (3.07%) |
2.42 |
2.30 - 2.42 |
0.8485 times |
Mon 24 November 2025 |
2.28 (0%) |
2.28 |
2.26 - 2.30 |
0.4017 times |
Fri 21 November 2025 |
2.28 (2.7%) |
2.28 |
2.22 - 2.33 |
0.8888 times |
Thu 20 November 2025 |
2.22 (2.78%) |
2.23 |
2.16 - 2.31 |
1.1542 times |
Weekly price and charts XbiotechInc Strong weekly Stock price targets for XbiotechInc XBIT are 2.37 and 2.79 | Weekly Target 1 | 2.05 | | Weekly Target 2 | 2.27 | | Weekly Target 3 | 2.4733333333333 | | Weekly Target 4 | 2.69 | | Weekly Target 5 | 2.89 |
Weekly price and volumes for Xbiotech Inc
| Date |
Closing |
Open |
Range |
Volume |
Fri 05 December 2025 |
2.48 (9.25%) |
2.40 |
2.26 - 2.68 |
0.8303 times |
Fri 28 November 2025 |
2.27 (-0.44%) |
2.28 |
2.26 - 2.42 |
0.3338 times |
Fri 21 November 2025 |
2.28 (-13.64%) |
2.63 |
2.15 - 2.64 |
0.7594 times |
Fri 14 November 2025 |
2.64 (12.82%) |
2.34 |
2.30 - 3.44 |
4.7867 times |
Fri 07 November 2025 |
2.34 (-0.43%) |
2.27 |
2.09 - 2.39 |
1.1107 times |
Fri 31 October 2025 |
2.35 (0%) |
2.40 |
2.33 - 2.41 |
0.0325 times |
Fri 31 October 2025 |
2.35 (-8.56%) |
2.61 |
2.33 - 2.64 |
0.4469 times |
Fri 24 October 2025 |
2.57 (3.21%) |
2.50 |
2.41 - 2.60 |
0.5391 times |
Fri 17 October 2025 |
2.49 (-1.97%) |
2.55 |
2.35 - 2.61 |
0.5173 times |
Fri 10 October 2025 |
2.54 (-3.79%) |
2.66 |
2.52 - 2.73 |
0.6432 times |
Fri 03 October 2025 |
2.64 (-2.22%) |
2.71 |
2.62 - 2.74 |
0.5107 times |

Monthly price and charts XbiotechInc Strong monthly Stock price targets for XbiotechInc XBIT are 2.37 and 2.79 | Monthly Target 1 | 2.05 | | Monthly Target 2 | 2.27 | | Monthly Target 3 | 2.4733333333333 | | Monthly Target 4 | 2.69 | | Monthly Target 5 | 2.89 |
Monthly price and volumes Xbiotech Inc
| Date |
Closing |
Open |
Range |
Volume |
Fri 05 December 2025 |
2.48 (9.25%) |
2.40 |
2.26 - 2.68 |
0.2876 times |
Fri 28 November 2025 |
2.27 (-3.4%) |
2.27 |
2.09 - 3.44 |
2.4211 times |
Fri 31 October 2025 |
2.35 (-11.65%) |
2.64 |
2.33 - 2.73 |
0.8812 times |
Tue 30 September 2025 |
2.66 (-15.82%) |
3.15 |
2.59 - 3.23 |
0.8015 times |
Fri 29 August 2025 |
3.16 (8.97%) |
2.85 |
2.81 - 3.61 |
0.6339 times |
Thu 31 July 2025 |
2.90 (-2.36%) |
2.99 |
2.75 - 3.32 |
0.6057 times |
Mon 30 June 2025 |
2.97 (4.21%) |
2.86 |
2.50 - 3.05 |
2.4184 times |
Fri 30 May 2025 |
2.85 (-6.25%) |
3.05 |
2.65 - 3.09 |
0.6429 times |
Wed 30 April 2025 |
3.04 (-6.17%) |
3.26 |
2.65 - 3.62 |
0.7442 times |
Mon 31 March 2025 |
3.24 (-7.95%) |
3.59 |
3.05 - 3.61 |
0.5636 times |
Fri 28 February 2025 |
3.52 (1.73%) |
3.40 |
2.94 - 3.54 |
0.6914 times |

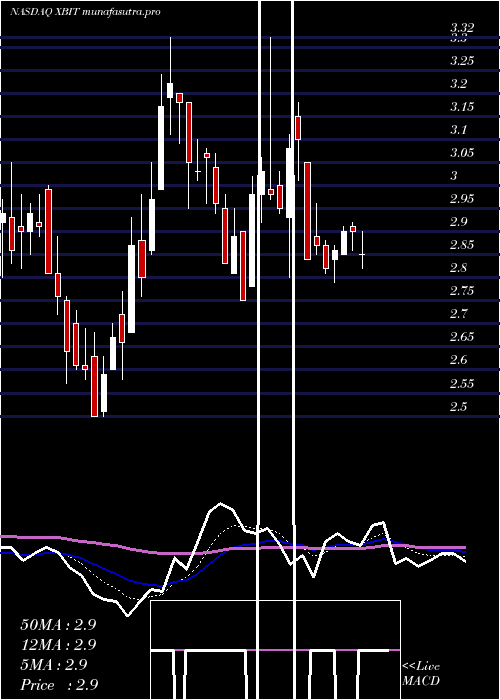
DMA SMA EMA moving averages of Xbiotech Inc XBIT
DMA (daily moving average) of Xbiotech Inc XBIT
| DMA period | DMA value | | 5 day DMA | 2.46 | | 12 day DMA | 2.35 | | 20 day DMA | 2.44 | | 35 day DMA | 2.43 | | 50 day DMA | 2.48 | | 100 day DMA | 2.73 | | 150 day DMA | 2.78 | | 200 day DMA | 2.87 | EMA (exponential moving average) of Xbiotech Inc XBIT
| EMA period | EMA current | EMA prev | EMA prev2 | | 5 day EMA | 2.46 | 2.45 | 2.42 | | 12 day EMA | 2.42 | 2.41 | 2.39 | | 20 day EMA | 2.42 | 2.41 | 2.4 | | 35 day EMA | 2.46 | 2.46 | 2.46 | | 50 day EMA | 2.5 | 2.5 | 2.5 |
SMA (simple moving average) of Xbiotech Inc XBIT
| SMA period | SMA current | SMA prev | SMA prev2 | | 5 day SMA | 2.46 | 2.42 | 2.37 | | 12 day SMA | 2.35 | 2.34 | 2.33 | | 20 day SMA | 2.44 | 2.43 | 2.41 | | 35 day SMA | 2.43 | 2.43 | 2.43 | | 50 day SMA | 2.48 | 2.49 | 2.49 | | 100 day SMA | 2.73 | 2.73 | 2.74 | | 150 day SMA | 2.78 | 2.78 | 2.78 | | 200 day SMA | 2.87 | 2.87 | 2.87 |
|
|
