VanguardInternational VYMI full analysis,charts,indicators,moving averages,SMA,DMA,EMA,ADX,MACD,RSIVanguard International VYMI WideScreen charts, DMA,SMA,EMA technical analysis, forecast prediction, by indicators ADX,MACD,RSI,CCI NASDAQ stock exchange
operates under N A sector & deals in N A
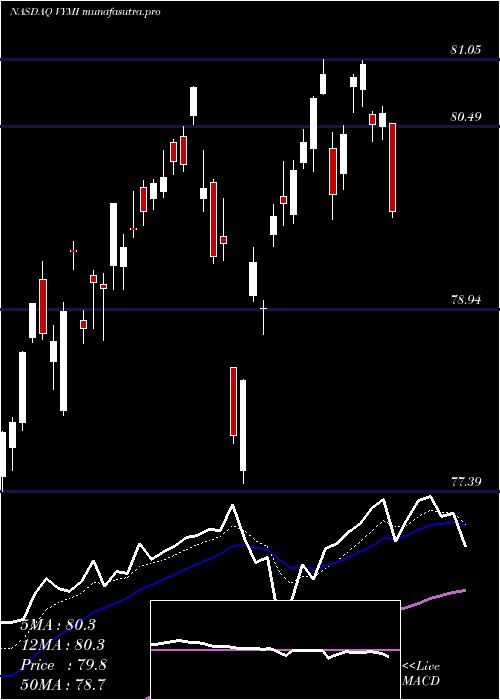
Daily price and charts and targets VanguardInternational Strong Daily Stock price targets for VanguardInternational VYMI are 88.17 and 88.69 | Daily Target 1 | 88.07 | | Daily Target 2 | 88.27 | | Daily Target 3 | 88.593333333333 | | Daily Target 4 | 88.79 | | Daily Target 5 | 89.11 |
Daily price and volume Vanguard International
| Date |
Closing |
Open |
Range |
Volume |
Fri 05 December 2025 |
88.46 (-0.02%) |
88.76 |
88.40 - 88.92 |
1.1859 times |
Thu 04 December 2025 |
88.48 (0.31%) |
88.50 |
88.34 - 88.68 |
0.8537 times |
Wed 03 December 2025 |
88.21 (0.34%) |
88.00 |
87.89 - 88.23 |
0.8877 times |
Tue 02 December 2025 |
87.91 (0.42%) |
88.00 |
87.64 - 88.02 |
0.8804 times |
Mon 01 December 2025 |
87.54 (-0.21%) |
87.80 |
87.49 - 87.95 |
1.0999 times |
Fri 28 November 2025 |
87.72 (0.26%) |
87.40 |
87.33 - 87.77 |
0.6719 times |
Wed 26 November 2025 |
87.49 (0.92%) |
87.02 |
86.98 - 87.61 |
0.9434 times |
Tue 25 November 2025 |
86.69 (1.17%) |
86.17 |
86.02 - 86.77 |
0.9069 times |
Mon 24 November 2025 |
85.69 (-0.01%) |
85.55 |
85.37 - 85.81 |
1.2682 times |
Fri 21 November 2025 |
85.70 (1.26%) |
85.20 |
84.96 - 85.86 |
1.3021 times |
Thu 20 November 2025 |
84.63 (-1.03%) |
85.88 |
84.61 - 86.03 |
1.7902 times |
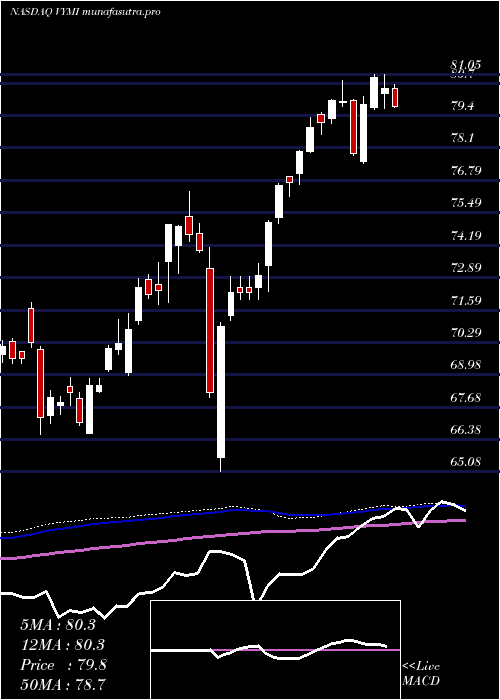
Weekly price and charts VanguardInternational Strong weekly Stock price targets for VanguardInternational VYMI are 87.98 and 89.41 | Weekly Target 1 | 86.86 | | Weekly Target 2 | 87.66 | | Weekly Target 3 | 88.29 | | Weekly Target 4 | 89.09 | | Weekly Target 5 | 89.72 |
Weekly price and volumes for Vanguard International
| Date |
Closing |
Open |
Range |
Volume |
Fri 05 December 2025 |
88.46 (0.84%) |
87.80 |
87.49 - 88.92 |
1.1281 times |
Fri 28 November 2025 |
87.72 (2.36%) |
85.55 |
85.37 - 87.77 |
0.8712 times |
Fri 21 November 2025 |
85.70 (-2.12%) |
86.93 |
84.61 - 87.17 |
1.6163 times |
Fri 14 November 2025 |
87.56 (1.7%) |
86.70 |
86.48 - 88.47 |
1.1167 times |
Fri 07 November 2025 |
86.10 (1.02%) |
84.77 |
84.59 - 86.10 |
0.8098 times |
Fri 31 October 2025 |
85.23 (0%) |
85.34 |
84.96 - 85.34 |
0.1814 times |
Fri 31 October 2025 |
85.23 (-0.42%) |
85.96 |
84.96 - 86.39 |
1.0729 times |
Fri 24 October 2025 |
85.59 (0.85%) |
85.13 |
84.70 - 85.71 |
0.9009 times |
Fri 17 October 2025 |
84.87 (2.35%) |
83.51 |
83.32 - 85.31 |
0.9794 times |
Fri 10 October 2025 |
82.92 (-2.89%) |
85.26 |
82.85 - 85.34 |
1.3233 times |
Fri 03 October 2025 |
85.39 (1.41%) |
84.41 |
84.25 - 85.47 |
0.9578 times |
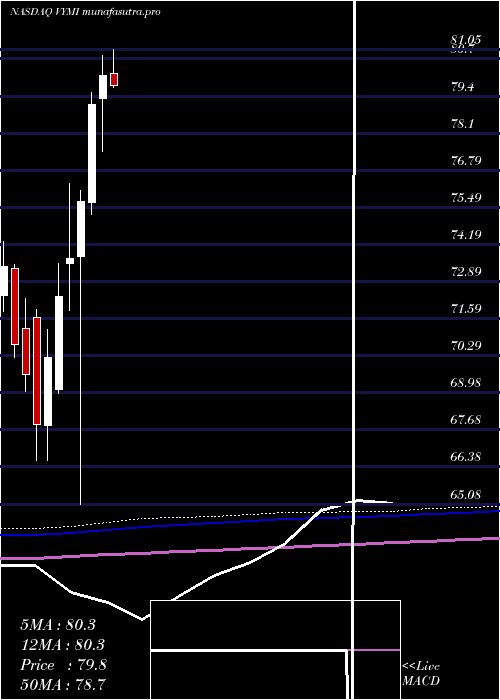
Monthly price and charts VanguardInternational Strong monthly Stock price targets for VanguardInternational VYMI are 87.98 and 89.41 | Monthly Target 1 | 86.86 | | Monthly Target 2 | 87.66 | | Monthly Target 3 | 88.29 | | Monthly Target 4 | 89.09 | | Monthly Target 5 | 89.72 |
Monthly price and volumes Vanguard International
| Date |
Closing |
Open |
Range |
Volume |
Fri 05 December 2025 |
88.46 (0.84%) |
87.80 |
87.49 - 88.92 |
0.2681 times |
Fri 28 November 2025 |
87.72 (2.92%) |
84.77 |
84.59 - 88.47 |
1.049 times |
Fri 31 October 2025 |
85.23 (0.65%) |
85.04 |
82.85 - 86.39 |
1.1959 times |
Tue 30 September 2025 |
84.68 (0.7%) |
83.13 |
83.06 - 86.08 |
1.1458 times |
Fri 29 August 2025 |
84.09 (5.14%) |
80.03 |
79.55 - 85.61 |
1.1146 times |
Thu 31 July 2025 |
79.98 (-0.16%) |
80.17 |
79.57 - 82.80 |
1.1884 times |
Mon 30 June 2025 |
80.11 (1.26%) |
79.30 |
77.46 - 80.82 |
1.0389 times |
Fri 30 May 2025 |
79.11 (4.49%) |
75.67 |
75.23 - 79.51 |
1.077 times |
Wed 30 April 2025 |
75.71 (2.74%) |
73.77 |
65.08 - 76.09 |
1.0879 times |
Mon 31 March 2025 |
73.69 (1.82%) |
73.53 |
71.88 - 76.33 |
0.8344 times |
Fri 28 February 2025 |
72.37 (3.05%) |
69.09 |
68.97 - 73.51 |
0.5472 times |
DMA SMA EMA moving averages of Vanguard International VYMI
DMA (daily moving average) of Vanguard International VYMI
| DMA period | DMA value | | 5 day DMA | 88.12 | | 12 day DMA | 87 | | 20 day DMA | 87.03 | | 35 day DMA | 86.35 | | 50 day DMA | 85.81 | | 100 day DMA | 84.6 | | 150 day DMA | 82.76 | | 200 day DMA | 80.37 | EMA (exponential moving average) of Vanguard International VYMI
| EMA period | EMA current | EMA prev | EMA prev2 | | 5 day EMA | 88.11 | 87.93 | 87.66 | | 12 day EMA | 87.48 | 87.3 | 87.08 | | 20 day EMA | 87.05 | 86.9 | 86.73 | | 35 day EMA | 86.45 | 86.33 | 86.2 | | 50 day EMA | 85.89 | 85.79 | 85.68 |
SMA (simple moving average) of Vanguard International VYMI
| SMA period | SMA current | SMA prev | SMA prev2 | | 5 day SMA | 88.12 | 87.97 | 87.77 | | 12 day SMA | 87 | 86.79 | 86.62 | | 20 day SMA | 87.03 | 86.9 | 86.75 | | 35 day SMA | 86.35 | 86.26 | 86.14 | | 50 day SMA | 85.81 | 85.7 | 85.61 | | 100 day SMA | 84.6 | 84.51 | 84.43 | | 150 day SMA | 82.76 | 82.68 | 82.59 | | 200 day SMA | 80.37 | 80.29 | 80.21 |
|
|
