VanguardTotal VXUS full analysis,charts,indicators,moving averages,SMA,DMA,EMA,ADX,MACD,RSIVanguard Total VXUS WideScreen charts, DMA,SMA,EMA technical analysis, forecast prediction, by indicators ADX,MACD,RSI,CCI NASDAQ stock exchange
operates under N A sector & deals in N A
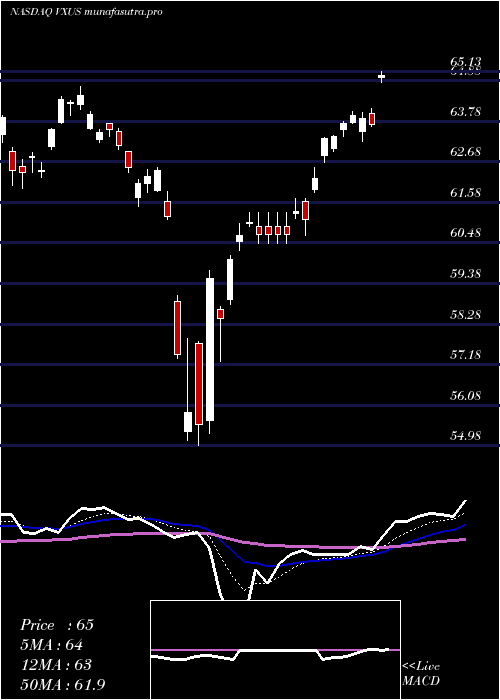
Daily price and charts and targets VanguardTotal Strong Daily Stock price targets for VanguardTotal VXUS are 75.13 and 75.58 | Daily Target 1 | 75.05 | | Daily Target 2 | 75.21 | | Daily Target 3 | 75.496666666667 | | Daily Target 4 | 75.66 | | Daily Target 5 | 75.95 |
Daily price and volume Vanguard Total
| Date |
Closing |
Open |
Range |
Volume |
Fri 05 December 2025 |
75.38 (0.2%) |
75.65 |
75.33 - 75.78 |
1.5157 times |
Thu 04 December 2025 |
75.23 (0.21%) |
75.33 |
75.07 - 75.39 |
1.1021 times |
Wed 03 December 2025 |
75.07 (0.4%) |
74.75 |
74.69 - 75.08 |
1.043 times |
Tue 02 December 2025 |
74.77 (0.16%) |
74.93 |
74.50 - 75.02 |
0.9241 times |
Mon 01 December 2025 |
74.65 (-0.39%) |
74.75 |
74.61 - 74.93 |
1.0806 times |
Fri 28 November 2025 |
74.94 (0.44%) |
74.66 |
74.58 - 74.96 |
0.5725 times |
Wed 26 November 2025 |
74.61 (0.95%) |
74.16 |
74.12 - 74.74 |
0.9943 times |
Tue 25 November 2025 |
73.91 (0.93%) |
73.42 |
73.13 - 73.93 |
0.8419 times |
Mon 24 November 2025 |
73.23 (0.43%) |
73.05 |
72.77 - 73.32 |
0.7757 times |
Fri 21 November 2025 |
72.92 (1.01%) |
72.42 |
72.11 - 73.12 |
1.15 times |
Thu 20 November 2025 |
72.19 (-1.33%) |
73.74 |
72.17 - 73.80 |
1.0787 times |
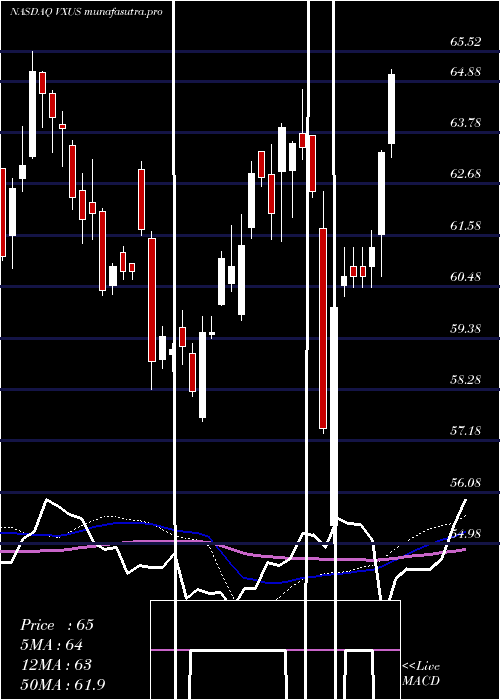
Weekly price and charts VanguardTotal Strong weekly Stock price targets for VanguardTotal VXUS are 74.94 and 76.22 | Weekly Target 1 | 73.94 | | Weekly Target 2 | 74.66 | | Weekly Target 3 | 75.22 | | Weekly Target 4 | 75.94 | | Weekly Target 5 | 76.5 |
Weekly price and volumes for Vanguard Total
| Date |
Closing |
Open |
Range |
Volume |
Fri 05 December 2025 |
75.38 (0.59%) |
74.75 |
74.50 - 75.78 |
1.1538 times |
Fri 28 November 2025 |
74.94 (2.77%) |
73.05 |
72.77 - 74.96 |
0.6485 times |
Fri 21 November 2025 |
72.92 (-2.68%) |
74.43 |
72.11 - 74.68 |
1.0647 times |
Fri 14 November 2025 |
74.93 (0.98%) |
74.83 |
74.35 - 76.05 |
1.2708 times |
Fri 07 November 2025 |
74.20 (-0.58%) |
73.90 |
73.37 - 74.50 |
0.8246 times |
Fri 31 October 2025 |
74.63 (0%) |
74.84 |
74.36 - 74.85 |
0.3463 times |
Fri 31 October 2025 |
74.63 (-0.43%) |
75.52 |
74.36 - 75.75 |
1.3166 times |
Fri 24 October 2025 |
74.95 (1.01%) |
74.55 |
73.93 - 75.06 |
1.236 times |
Fri 17 October 2025 |
74.20 (2.81%) |
73.10 |
72.48 - 74.78 |
0.9044 times |
Fri 10 October 2025 |
72.17 (-3.52%) |
74.88 |
72.08 - 75.00 |
1.2344 times |
Fri 03 October 2025 |
74.80 (2.82%) |
73.10 |
73.01 - 74.96 |
1.0748 times |
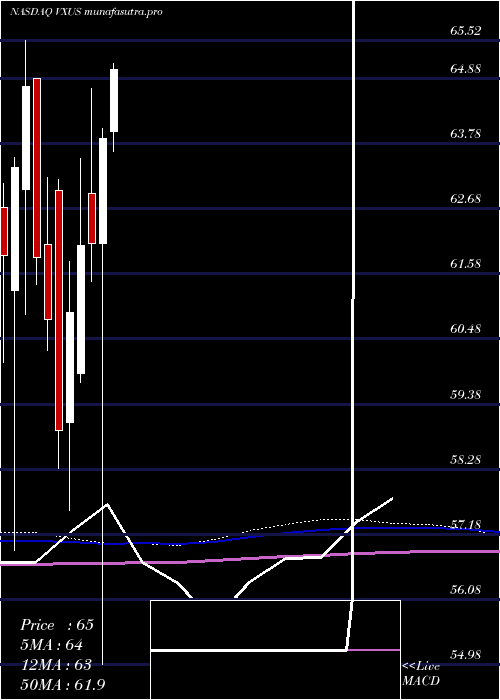
Monthly price and charts VanguardTotal Strong monthly Stock price targets for VanguardTotal VXUS are 74.94 and 76.22 | Monthly Target 1 | 73.94 | | Monthly Target 2 | 74.66 | | Monthly Target 3 | 75.22 | | Monthly Target 4 | 75.94 | | Monthly Target 5 | 76.5 |
Monthly price and volumes Vanguard Total
| Date |
Closing |
Open |
Range |
Volume |
Fri 05 December 2025 |
75.38 (0.59%) |
74.75 |
74.50 - 75.78 |
0.2757 times |
Fri 28 November 2025 |
74.94 (0.42%) |
73.90 |
72.11 - 76.05 |
0.9102 times |
Fri 31 October 2025 |
74.63 (1.59%) |
73.78 |
72.08 - 75.75 |
1.3683 times |
Tue 30 September 2025 |
73.46 (2.93%) |
70.43 |
70.36 - 74.21 |
1.0832 times |
Fri 29 August 2025 |
71.37 (4.24%) |
68.41 |
67.85 - 72.46 |
0.9478 times |
Thu 31 July 2025 |
68.47 (-0.9%) |
69.02 |
68.36 - 71.08 |
1.0244 times |
Mon 30 June 2025 |
69.09 (3.21%) |
67.19 |
66.25 - 69.14 |
1.0764 times |
Fri 30 May 2025 |
66.94 (4.82%) |
63.99 |
63.64 - 67.49 |
0.9346 times |
Wed 30 April 2025 |
63.86 (2.83%) |
62.09 |
54.98 - 64.04 |
1.3237 times |
Mon 31 March 2025 |
62.10 (0.08%) |
62.94 |
61.44 - 64.71 |
1.0556 times |
Fri 28 February 2025 |
62.05 (1.85%) |
59.89 |
59.75 - 63.53 |
0.7689 times |
DMA SMA EMA moving averages of Vanguard Total VXUS
DMA (daily moving average) of Vanguard Total VXUS
| DMA period | DMA value | | 5 day DMA | 75.02 | | 12 day DMA | 74.17 | | 20 day DMA | 74.4 | | 35 day DMA | 74.51 | | 50 day DMA | 74.29 | | 100 day DMA | 72.8 | | 150 day DMA | 71.03 | | 200 day DMA | 68.79 | EMA (exponential moving average) of Vanguard Total VXUS
| EMA period | EMA current | EMA prev | EMA prev2 | | 5 day EMA | 75.03 | 74.86 | 74.68 | | 12 day EMA | 74.64 | 74.51 | 74.38 | | 20 day EMA | 74.49 | 74.4 | 74.31 | | 35 day EMA | 74.31 | 74.25 | 74.19 | | 50 day EMA | 74.28 | 74.23 | 74.19 |
SMA (simple moving average) of Vanguard Total VXUS
| SMA period | SMA current | SMA prev | SMA prev2 | | 5 day SMA | 75.02 | 74.93 | 74.81 | | 12 day SMA | 74.17 | 74 | 73.9 | | 20 day SMA | 74.4 | 74.33 | 74.29 | | 35 day SMA | 74.51 | 74.48 | 74.44 | | 50 day SMA | 74.29 | 74.24 | 74.19 | | 100 day SMA | 72.8 | 72.74 | 72.67 | | 150 day SMA | 71.03 | 70.95 | 70.87 | | 200 day SMA | 68.79 | 68.72 | 68.66 |
|
|
