VanguardEmerging VWOB full analysis,charts,indicators,moving averages,SMA,DMA,EMA,ADX,MACD,RSIVanguard Emerging VWOB WideScreen charts, DMA,SMA,EMA technical analysis, forecast prediction, by indicators ADX,MACD,RSI,CCI NASDAQ stock exchange
operates under N A sector & deals in N A
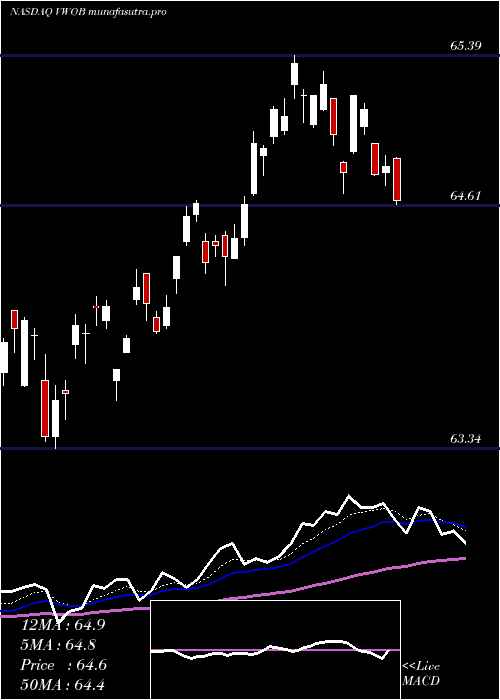
Daily price and charts and targets VanguardEmerging Strong Daily Stock price targets for VanguardEmerging VWOB are 65.21 and 65.35 | Daily Target 1 | 65.17 | | Daily Target 2 | 65.25 | | Daily Target 3 | 65.313333333333 | | Daily Target 4 | 65.39 | | Daily Target 5 | 65.45 |
Daily price and volume Vanguard Emerging
| Date |
Closing |
Open |
Range |
Volume |
Fri 01 August 2025 |
65.32 (-0.29%) |
65.38 |
65.24 - 65.38 |
1.6983 times |
Thu 31 July 2025 |
65.51 (0.02%) |
65.63 |
65.47 - 65.65 |
0.6072 times |
Wed 30 July 2025 |
65.50 (-0.23%) |
65.51 |
65.37 - 65.65 |
0.4068 times |
Tue 29 July 2025 |
65.65 (0.41%) |
65.50 |
65.48 - 65.68 |
0.6417 times |
Mon 28 July 2025 |
65.38 (-0.03%) |
65.35 |
65.30 - 65.40 |
0.7278 times |
Fri 25 July 2025 |
65.40 (0.28%) |
65.21 |
65.19 - 65.40 |
0.6909 times |
Thu 24 July 2025 |
65.22 (-0.02%) |
65.11 |
65.09 - 65.29 |
0.6615 times |
Wed 23 July 2025 |
65.23 (0.06%) |
65.18 |
65.12 - 65.27 |
0.8694 times |
Tue 22 July 2025 |
65.19 (0.23%) |
65.12 |
65.04 - 65.26 |
3.1444 times |
Mon 21 July 2025 |
65.04 (0.32%) |
65.11 |
65.03 - 65.22 |
0.5519 times |
Fri 18 July 2025 |
64.83 (0.23%) |
64.83 |
64.78 - 64.89 |
2.1565 times |
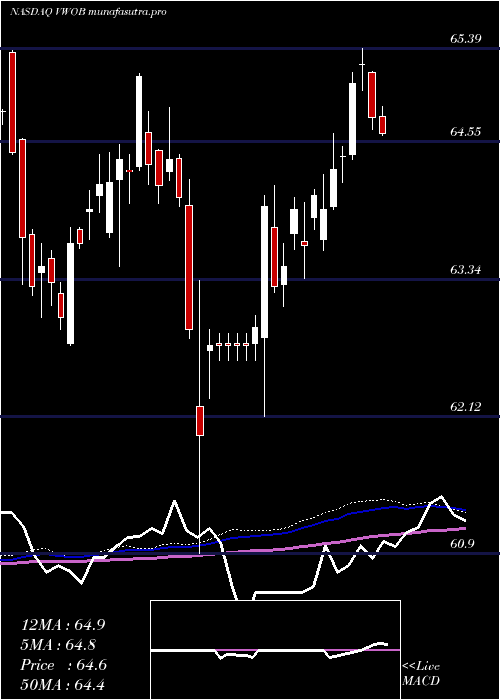
Weekly price and charts VanguardEmerging Strong weekly Stock price targets for VanguardEmerging VWOB are 65.06 and 65.5 | Weekly Target 1 | 64.97 | | Weekly Target 2 | 65.15 | | Weekly Target 3 | 65.413333333333 | | Weekly Target 4 | 65.59 | | Weekly Target 5 | 65.85 |
Weekly price and volumes for Vanguard Emerging
| Date |
Closing |
Open |
Range |
Volume |
Fri 01 August 2025 |
65.32 (-0.12%) |
65.35 |
65.24 - 65.68 |
0.9739 times |
Fri 25 July 2025 |
65.40 (0.88%) |
65.11 |
65.03 - 65.40 |
1.4121 times |
Fri 18 July 2025 |
64.83 (0.09%) |
64.78 |
64.44 - 64.89 |
2.9948 times |
Fri 11 July 2025 |
64.77 (-0.72%) |
65.17 |
64.67 - 65.18 |
1.8992 times |
Thu 03 July 2025 |
65.24 (0.26%) |
65.24 |
65.01 - 65.39 |
0.3991 times |
Fri 27 June 2025 |
65.07 (0.99%) |
64.44 |
64.40 - 65.17 |
0.5196 times |
Fri 20 June 2025 |
64.43 (0.19%) |
64.42 |
64.19 - 64.51 |
0.2127 times |
Fri 13 June 2025 |
64.31 (0.56%) |
63.98 |
63.96 - 64.63 |
0.4569 times |
Fri 06 June 2025 |
63.95 (-0.2%) |
63.69 |
63.59 - 64.27 |
0.5918 times |
Fri 30 May 2025 |
64.08 (0.71%) |
63.88 |
63.78 - 64.13 |
0.5398 times |
Fri 23 May 2025 |
63.63 (-0.52%) |
63.67 |
63.34 - 64.02 |
0.6922 times |
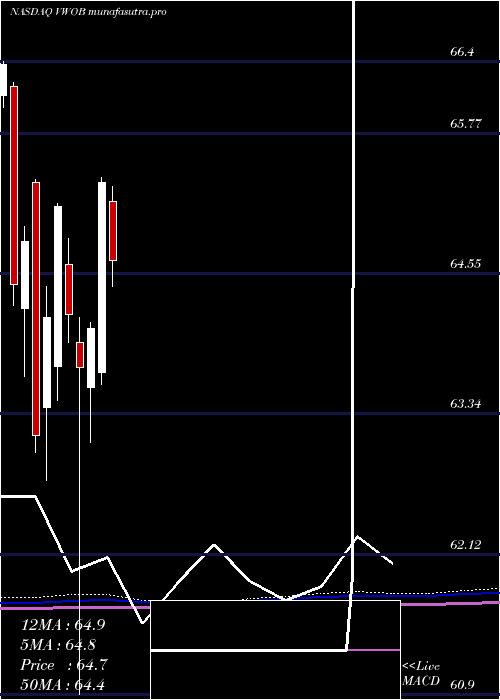
Monthly price and charts VanguardEmerging Strong monthly Stock price targets for VanguardEmerging VWOB are 65.21 and 65.35 | Monthly Target 1 | 65.17 | | Monthly Target 2 | 65.25 | | Monthly Target 3 | 65.313333333333 | | Monthly Target 4 | 65.39 | | Monthly Target 5 | 65.45 |
Monthly price and volumes Vanguard Emerging
| Date |
Closing |
Open |
Range |
Volume |
Fri 01 August 2025 |
65.32 (-0.29%) |
65.38 |
65.24 - 65.38 |
0.1259 times |
Thu 31 July 2025 |
65.51 (0.24%) |
65.18 |
64.44 - 65.68 |
2.2277 times |
Mon 30 June 2025 |
65.35 (1.98%) |
63.69 |
63.59 - 65.39 |
0.5849 times |
Fri 30 May 2025 |
64.08 (0.53%) |
63.57 |
63.09 - 64.13 |
1.016 times |
Wed 30 April 2025 |
63.74 (-0.72%) |
63.96 |
60.90 - 64.17 |
1.3353 times |
Mon 31 March 2025 |
64.20 (-1.44%) |
64.64 |
63.96 - 64.86 |
1.0245 times |
Fri 28 February 2025 |
65.14 (1.5%) |
63.75 |
63.45 - 65.16 |
0.8628 times |
Fri 31 January 2025 |
64.18 (1.63%) |
63.39 |
62.75 - 64.44 |
1.0481 times |
Tue 31 December 2024 |
63.15 (-2.59%) |
65.35 |
63.00 - 65.37 |
0.612 times |
Tue 26 November 2024 |
64.83 (0.57%) |
64.25 |
63.66 - 64.97 |
1.1628 times |
Thu 31 October 2024 |
64.46 (-2.88%) |
66.18 |
64.28 - 66.22 |
0.588 times |
DMA SMA EMA moving averages of Vanguard Emerging VWOB
DMA (daily moving average) of Vanguard Emerging VWOB
| DMA period | DMA value | | 5 day DMA | 65.47 | | 12 day DMA | 65.25 | | 20 day DMA | 65.09 | | 35 day DMA | 64.97 | | 50 day DMA | 64.66 | | 100 day DMA | 64.05 | | 150 day DMA | 64.03 | | 200 day DMA | 64.16 | EMA (exponential moving average) of Vanguard Emerging VWOB
| EMA period | EMA current | EMA prev | EMA prev2 | | 5 day EMA | 65.41 | 65.46 | 65.43 | | 12 day EMA | 65.28 | 65.27 | 65.23 | | 20 day EMA | 65.16 | 65.14 | 65.1 | | 35 day EMA | 64.9 | 64.88 | 64.84 | | 50 day EMA | 64.68 | 64.65 | 64.61 |
SMA (simple moving average) of Vanguard Emerging VWOB
| SMA period | SMA current | SMA prev | SMA prev2 | | 5 day SMA | 65.47 | 65.49 | 65.43 | | 12 day SMA | 65.25 | 65.19 | 65.12 | | 20 day SMA | 65.09 | 65.09 | 65.07 | | 35 day SMA | 64.97 | 64.95 | 64.91 | | 50 day SMA | 64.66 | 64.63 | 64.6 | | 100 day SMA | 64.05 | 64.04 | 64.03 | | 150 day SMA | 64.03 | 64.02 | 64 | | 200 day SMA | 64.16 | 64.16 | 64.16 |
|
|
