VanguardRussell VTWV full analysis,charts,indicators,moving averages,SMA,DMA,EMA,ADX,MACD,RSIVanguard Russell VTWV WideScreen charts, DMA,SMA,EMA technical analysis, forecast prediction, by indicators ADX,MACD,RSI,CCI NASDAQ stock exchange
operates under N A sector & deals in N A
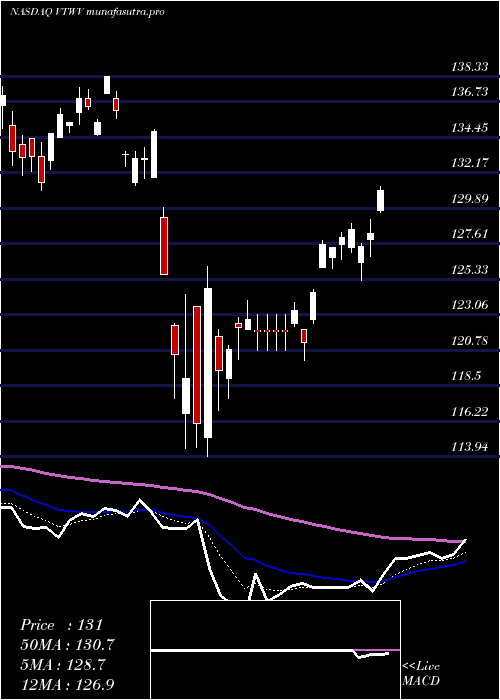
Daily price and charts and targets VanguardRussell Strong Daily Stock price targets for VanguardRussell VTWV are 144.9 and 145.85 | Daily Target 1 | 144.73 | | Daily Target 2 | 145.07 | | Daily Target 3 | 145.67666666667 | | Daily Target 4 | 146.02 | | Daily Target 5 | 146.63 |
Daily price and volume Vanguard Russell
| Date |
Closing |
Open |
Range |
Volume |
Fri 11 July 2025 |
145.42 (-1.1%) |
146.28 |
145.33 - 146.28 |
0.2453 times |
Thu 10 July 2025 |
147.03 (0.88%) |
145.60 |
145.60 - 147.48 |
0.6088 times |
Wed 09 July 2025 |
145.75 (0.91%) |
145.25 |
144.21 - 145.75 |
0.3953 times |
Tue 08 July 2025 |
144.43 (0.96%) |
143.31 |
143.31 - 144.95 |
0.1408 times |
Mon 07 July 2025 |
143.06 (-1.7%) |
144.79 |
142.90 - 144.99 |
0.527 times |
Thu 03 July 2025 |
145.53 (0.71%) |
144.99 |
144.99 - 145.65 |
0.3226 times |
Wed 02 July 2025 |
144.51 (1.77%) |
142.52 |
141.88 - 144.51 |
4.0527 times |
Tue 01 July 2025 |
142.00 (2.09%) |
138.44 |
138.44 - 143.62 |
2.6261 times |
Mon 30 June 2025 |
139.09 (0.13%) |
139.37 |
138.68 - 139.37 |
0.527 times |
Fri 27 June 2025 |
138.91 (0.01%) |
138.97 |
138.13 - 139.85 |
0.5543 times |
Thu 26 June 2025 |
138.89 (1.61%) |
137.54 |
137.54 - 138.89 |
0.4907 times |
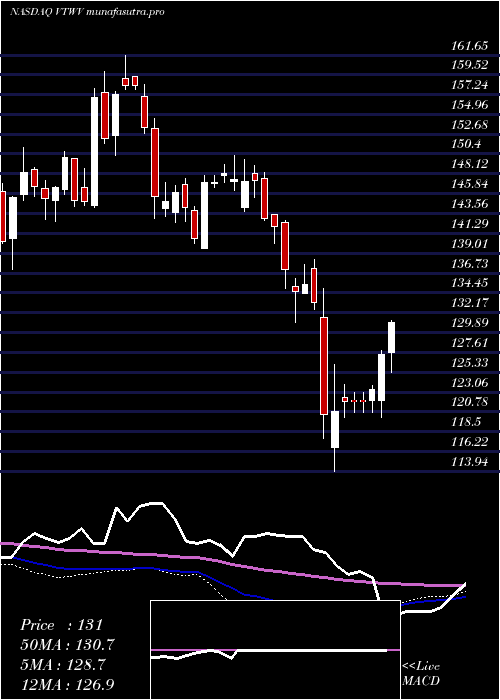
Weekly price and charts VanguardRussell Strong weekly Stock price targets for VanguardRussell VTWV are 144.16 and 148.74 | Weekly Target 1 | 140.69 | | Weekly Target 2 | 143.05 | | Weekly Target 3 | 145.26666666667 | | Weekly Target 4 | 147.63 | | Weekly Target 5 | 149.85 |
Weekly price and volumes for Vanguard Russell
| Date |
Closing |
Open |
Range |
Volume |
Fri 11 July 2025 |
145.42 (-0.08%) |
144.79 |
142.90 - 147.48 |
0.5819 times |
Thu 03 July 2025 |
145.53 (4.77%) |
139.37 |
138.44 - 145.65 |
2.2849 times |
Fri 27 June 2025 |
138.91 (2.85%) |
134.64 |
134.13 - 139.85 |
0.9887 times |
Fri 20 June 2025 |
135.06 (-0.02%) |
135.93 |
134.75 - 136.87 |
0.3309 times |
Fri 13 June 2025 |
135.09 (-0.81%) |
136.89 |
134.91 - 139.19 |
1.1569 times |
Fri 06 June 2025 |
136.19 (2.33%) |
132.74 |
131.65 - 136.42 |
0.6522 times |
Fri 30 May 2025 |
133.09 (1.59%) |
132.57 |
131.82 - 134.59 |
1.1942 times |
Fri 23 May 2025 |
131.01 (-3.99%) |
134.48 |
129.36 - 136.13 |
0.7295 times |
Fri 16 May 2025 |
136.45 (3.75%) |
136.13 |
134.10 - 136.75 |
0.8343 times |
Fri 09 May 2025 |
131.52 (0.4%) |
130.00 |
128.45 - 132.06 |
1.2466 times |
Fri 02 May 2025 |
131.00 (2.83%) |
127.58 |
125.26 - 131.26 |
1.452 times |
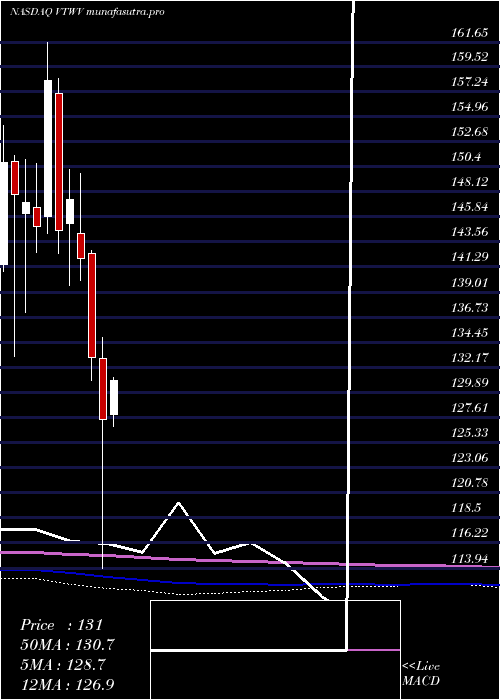
Monthly price and charts VanguardRussell Strong monthly Stock price targets for VanguardRussell VTWV are 141.93 and 150.97 | Monthly Target 1 | 134.74 | | Monthly Target 2 | 140.08 | | Monthly Target 3 | 143.78 | | Monthly Target 4 | 149.12 | | Monthly Target 5 | 152.82 |
Monthly price and volumes Vanguard Russell
| Date |
Closing |
Open |
Range |
Volume |
Fri 11 July 2025 |
145.42 (4.55%) |
138.44 |
138.44 - 147.48 |
0.4079 times |
Mon 30 June 2025 |
139.09 (4.51%) |
132.74 |
131.65 - 139.85 |
0.4956 times |
Fri 30 May 2025 |
133.09 (4.44%) |
127.88 |
126.78 - 136.75 |
0.7018 times |
Wed 30 April 2025 |
127.43 (-4.25%) |
133.00 |
113.94 - 134.92 |
1.4877 times |
Mon 31 March 2025 |
133.09 (-6.29%) |
142.50 |
131.01 - 142.75 |
0.8036 times |
Fri 28 February 2025 |
142.02 (-3.68%) |
144.30 |
140.09 - 149.74 |
1.1197 times |
Fri 31 January 2025 |
147.44 (1.96%) |
145.26 |
139.58 - 150.19 |
1.513 times |
Tue 31 December 2024 |
144.61 (-8.61%) |
157.02 |
142.54 - 158.39 |
1.011 times |
Tue 26 November 2024 |
158.23 (9.18%) |
145.84 |
144.28 - 161.65 |
1.3722 times |
Thu 31 October 2024 |
144.93 (-1.51%) |
146.72 |
142.59 - 150.65 |
1.0875 times |
Mon 30 September 2024 |
147.15 (-0.48%) |
146.12 |
137.15 - 151.09 |
1.6219 times |
DMA SMA EMA moving averages of Vanguard Russell VTWV
DMA (daily moving average) of Vanguard Russell VTWV
| DMA period | DMA value | | 5 day DMA | 145.14 | | 12 day DMA | 142.61 | | 20 day DMA | 140.14 | | 35 day DMA | 137.56 | | 50 day DMA | 135.9 | | 100 day DMA | 134.09 | | 150 day DMA | 138.78 | | 200 day DMA | 141.28 | EMA (exponential moving average) of Vanguard Russell VTWV
| EMA period | EMA current | EMA prev | EMA prev2 | | 5 day EMA | 145.21 | 145.1 | 144.14 | | 12 day EMA | 143.05 | 142.62 | 141.82 | | 20 day EMA | 141.08 | 140.62 | 139.95 | | 35 day EMA | 138.37 | 137.96 | 137.43 | | 50 day EMA | 136 | 135.62 | 135.15 |
SMA (simple moving average) of Vanguard Russell VTWV
| SMA period | SMA current | SMA prev | SMA prev2 | | 5 day SMA | 145.14 | 145.16 | 144.66 | | 12 day SMA | 142.61 | 142 | 141.17 | | 20 day SMA | 140.14 | 139.79 | 139.31 | | 35 day SMA | 137.56 | 137.29 | 136.98 | | 50 day SMA | 135.9 | 135.55 | 135.15 | | 100 day SMA | 134.09 | 134.12 | 134.11 | | 150 day SMA | 138.78 | 138.86 | 138.91 | | 200 day SMA | 141.28 | 141.28 | 141.26 |
|
|
