VanguardRussell VTWG full analysis,charts,indicators,moving averages,SMA,DMA,EMA,ADX,MACD,RSIVanguard Russell VTWG WideScreen charts, DMA,SMA,EMA technical analysis, forecast prediction, by indicators ADX,MACD,RSI,CCI NASDAQ stock exchange
operates under N A sector & deals in N A
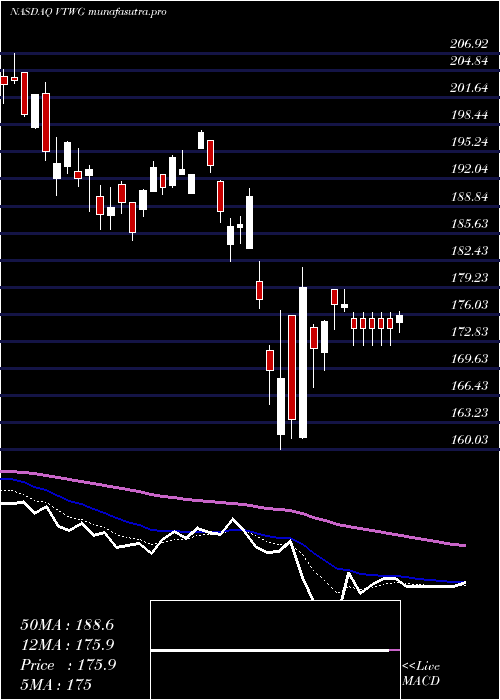
Daily price and charts and targets VanguardRussell Strong Daily Stock price targets for VanguardRussell VTWG are 209.74 and 211.94 | Daily Target 1 | 209.37 | | Daily Target 2 | 210.11 | | Daily Target 3 | 211.56666666667 | | Daily Target 4 | 212.31 | | Daily Target 5 | 213.77 |
Daily price and volume Vanguard Russell
| Date |
Closing |
Open |
Range |
Volume |
Fri 11 July 2025 |
210.86 (-1.55%) |
212.43 |
210.82 - 213.02 |
0.4233 times |
Thu 10 July 2025 |
214.17 (0.14%) |
213.87 |
213.10 - 215.31 |
0.6727 times |
Wed 09 July 2025 |
213.86 (1.24%) |
212.62 |
211.34 - 213.87 |
1.9123 times |
Tue 08 July 2025 |
211.24 (0.39%) |
211.11 |
210.60 - 211.82 |
0.5896 times |
Mon 07 July 2025 |
210.42 (-1.32%) |
211.38 |
209.07 - 212.22 |
1.0884 times |
Thu 03 July 2025 |
213.24 (1.19%) |
211.52 |
211.52 - 213.24 |
0.6652 times |
Wed 02 July 2025 |
210.73 (1.21%) |
208.17 |
208.17 - 210.73 |
0.5064 times |
Tue 01 July 2025 |
208.22 (-0.12%) |
207.26 |
206.66 - 210.25 |
1.9501 times |
Mon 30 June 2025 |
208.47 (0.21%) |
209.91 |
208.43 - 209.91 |
0.8692 times |
Fri 27 June 2025 |
208.04 (0.07%) |
208.33 |
207.45 - 209.35 |
1.3228 times |
Thu 26 June 2025 |
207.90 (1.58%) |
206.28 |
206.12 - 207.90 |
1.1111 times |
Weekly price and charts VanguardRussell Strong weekly Stock price targets for VanguardRussell VTWG are 206.85 and 213.09 | Weekly Target 1 | 205.51 | | Weekly Target 2 | 208.18 | | Weekly Target 3 | 211.74666666667 | | Weekly Target 4 | 214.42 | | Weekly Target 5 | 217.99 |
Weekly price and volumes for Vanguard Russell
| Date |
Closing |
Open |
Range |
Volume |
Fri 11 July 2025 |
210.86 (-1.12%) |
211.38 |
209.07 - 215.31 |
1.0931 times |
Thu 03 July 2025 |
213.24 (2.5%) |
209.91 |
206.66 - 213.24 |
0.9309 times |
Fri 27 June 2025 |
208.04 (3.18%) |
200.30 |
198.84 - 209.35 |
1.4475 times |
Fri 20 June 2025 |
201.63 (0.47%) |
201.59 |
201.24 - 204.06 |
0.3826 times |
Fri 13 June 2025 |
200.69 (-2.18%) |
206.96 |
200.51 - 208.22 |
0.9714 times |
Fri 06 June 2025 |
205.17 (4.02%) |
197.87 |
195.00 - 205.17 |
0.908 times |
Fri 30 May 2025 |
197.24 (1.34%) |
197.61 |
195.23 - 199.71 |
1.2165 times |
Fri 23 May 2025 |
194.64 (-3.33%) |
197.56 |
192.02 - 200.84 |
0.8815 times |
Fri 16 May 2025 |
201.35 (5.46%) |
198.85 |
196.28 - 201.35 |
1.109 times |
Fri 09 May 2025 |
190.92 (-0.09%) |
189.19 |
186.37 - 193.38 |
1.0596 times |
Fri 02 May 2025 |
191.10 (3.67%) |
184.65 |
181.92 - 192.03 |
1.6819 times |
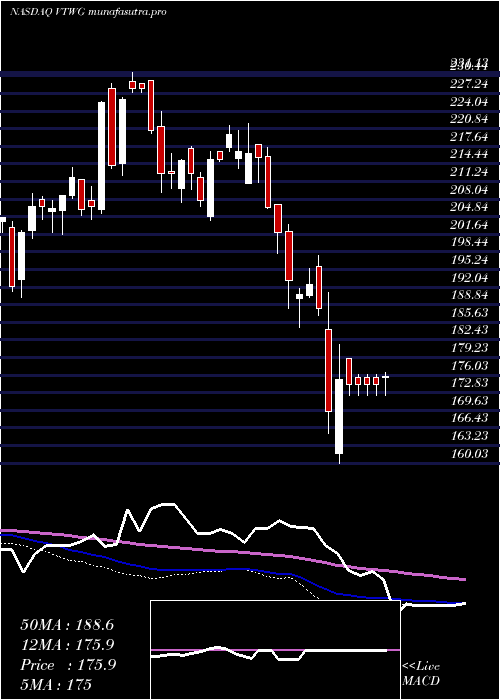
Monthly price and charts VanguardRussell Strong monthly Stock price targets for VanguardRussell VTWG are 208.76 and 217.41 | Monthly Target 1 | 202.29 | | Monthly Target 2 | 206.58 | | Monthly Target 3 | 210.94333333333 | | Monthly Target 4 | 215.23 | | Monthly Target 5 | 219.59 |
Monthly price and volumes Vanguard Russell
| Date |
Closing |
Open |
Range |
Volume |
Fri 11 July 2025 |
210.86 (1.15%) |
207.26 |
206.66 - 215.31 |
0.195 times |
Mon 30 June 2025 |
208.47 (5.69%) |
197.87 |
195.00 - 209.91 |
0.4189 times |
Fri 30 May 2025 |
197.24 (6.68%) |
186.62 |
186.30 - 201.35 |
0.5251 times |
Wed 30 April 2025 |
184.89 (-0.79%) |
186.30 |
160.03 - 190.96 |
1.7425 times |
Mon 31 March 2025 |
186.36 (-7.74%) |
202.19 |
182.28 - 203.49 |
1.2729 times |
Fri 28 February 2025 |
202.00 (-6.74%) |
210.92 |
198.05 - 221.71 |
1.0302 times |
Fri 31 January 2025 |
216.60 (3.07%) |
211.75 |
204.18 - 221.42 |
1.0204 times |
Tue 31 December 2024 |
210.14 (-7.91%) |
229.64 |
207.41 - 229.64 |
1.1282 times |
Tue 26 November 2024 |
228.20 (11.6%) |
206.43 |
205.49 - 231.13 |
1.5514 times |
Thu 31 October 2024 |
204.48 (-1.34%) |
206.80 |
201.64 - 213.85 |
1.1154 times |
Mon 30 September 2024 |
207.25 (1.29%) |
202.79 |
190.06 - 209.12 |
1.1546 times |

DMA SMA EMA moving averages of Vanguard Russell VTWG
DMA (daily moving average) of Vanguard Russell VTWG
| DMA period | DMA value | | 5 day DMA | 212.11 | | 12 day DMA | 210.15 | | 20 day DMA | 207.47 | | 35 day DMA | 204.25 | | 50 day DMA | 200.82 | | 100 day DMA | 194.37 | | 150 day DMA | 201.72 | | 200 day DMA | 204.1 | EMA (exponential moving average) of Vanguard Russell VTWG
| EMA period | EMA current | EMA prev | EMA prev2 | | 5 day EMA | 211.95 | 212.49 | 211.65 | | 12 day EMA | 210.17 | 210.05 | 209.3 | | 20 day EMA | 208.03 | 207.73 | 207.05 | | 35 day EMA | 204.01 | 203.61 | 202.99 | | 50 day EMA | 200.26 | 199.83 | 199.24 |
SMA (simple moving average) of Vanguard Russell VTWG
| SMA period | SMA current | SMA prev | SMA prev2 | | 5 day SMA | 212.11 | 212.59 | 211.9 | | 12 day SMA | 210.15 | 209.83 | 208.95 | | 20 day SMA | 207.47 | 207.26 | 206.85 | | 35 day SMA | 204.25 | 203.95 | 203.58 | | 50 day SMA | 200.82 | 200.3 | 199.71 | | 100 day SMA | 194.37 | 194.42 | 194.44 | | 150 day SMA | 201.72 | 201.85 | 201.92 | | 200 day SMA | 204.1 | 204.06 | 204 |
|
|
