VtvTherapeutics VTVT full analysis,charts,indicators,moving averages,SMA,DMA,EMA,ADX,MACD,RSIVtv Therapeutics VTVT WideScreen charts, DMA,SMA,EMA technical analysis, forecast prediction, by indicators ADX,MACD,RSI,CCI NASDAQ stock exchange
operates under Health Care sector & deals in Major Pharmaceuticals
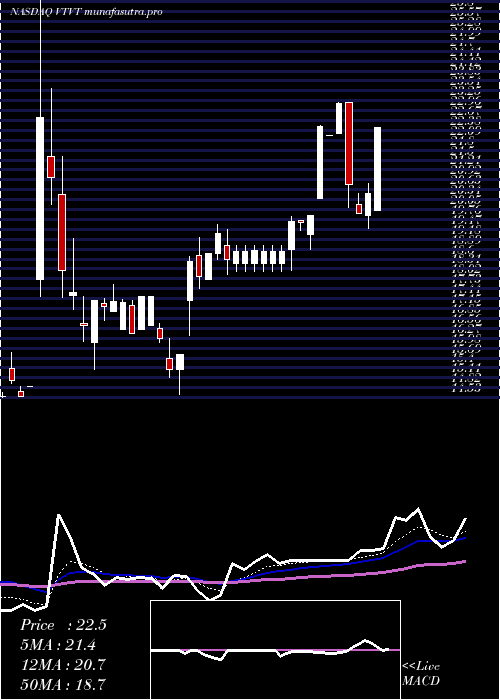
Daily price and charts and targets VtvTherapeutics Strong Daily Stock price targets for VtvTherapeutics VTVT are 27.03 and 27.68 | Daily Target 1 | 26.92 | | Daily Target 2 | 27.13 | | Daily Target 3 | 27.566666666667 | | Daily Target 4 | 27.78 | | Daily Target 5 | 28.22 |
Daily price and volume Vtv Therapeutics
| Date |
Closing |
Open |
Range |
Volume |
Fri 05 December 2025 |
27.35 (-0.07%) |
27.79 |
27.35 - 28.00 |
0.8385 times |
Thu 04 December 2025 |
27.37 (5.84%) |
25.98 |
25.98 - 27.68 |
0.8799 times |
Wed 03 December 2025 |
25.86 (2.46%) |
25.32 |
25.31 - 27.38 |
0.4762 times |
Tue 02 December 2025 |
25.24 (7.4%) |
24.58 |
24.30 - 25.88 |
0.5176 times |
Mon 01 December 2025 |
23.50 (-11.99%) |
25.63 |
22.92 - 26.88 |
1.5839 times |
Fri 28 November 2025 |
26.70 (-1.11%) |
27.20 |
26.70 - 27.20 |
0.4762 times |
Wed 26 November 2025 |
27.00 (-3.16%) |
27.18 |
26.55 - 27.53 |
0.7453 times |
Tue 25 November 2025 |
27.88 (-6.63%) |
29.33 |
27.00 - 29.33 |
1.9979 times |
Mon 24 November 2025 |
29.86 (1.01%) |
29.57 |
29.57 - 32.53 |
1.4389 times |
Fri 21 November 2025 |
29.56 (-6.25%) |
30.23 |
29.56 - 31.25 |
1.0455 times |
Thu 20 November 2025 |
31.53 (-2.2%) |
32.24 |
31.20 - 32.24 |
1.2112 times |
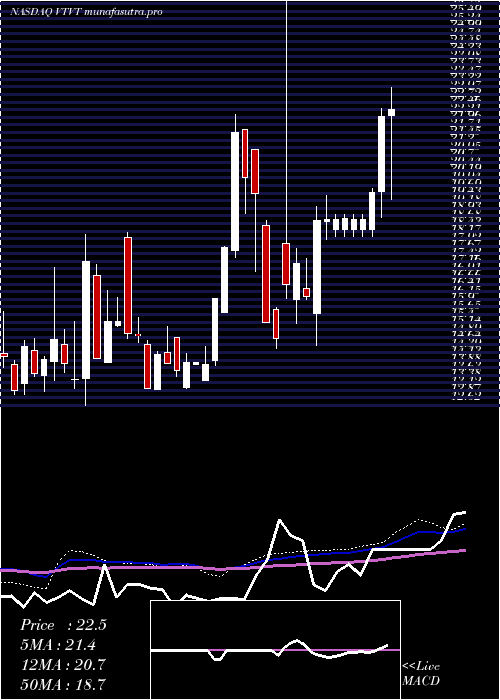
Weekly price and charts VtvTherapeutics Strong weekly Stock price targets for VtvTherapeutics VTVT are 25.14 and 30.22 | Weekly Target 1 | 21.01 | | Weekly Target 2 | 24.18 | | Weekly Target 3 | 26.09 | | Weekly Target 4 | 29.26 | | Weekly Target 5 | 31.17 |
Weekly price and volumes for Vtv Therapeutics
| Date |
Closing |
Open |
Range |
Volume |
Fri 05 December 2025 |
27.35 (2.43%) |
25.63 |
22.92 - 28.00 |
1.1289 times |
Fri 28 November 2025 |
26.70 (-9.68%) |
29.57 |
26.55 - 32.53 |
1.2242 times |
Fri 21 November 2025 |
29.56 (-4.03%) |
30.74 |
29.40 - 33.16 |
2.3449 times |
Fri 14 November 2025 |
30.80 (18.37%) |
25.91 |
25.80 - 33.06 |
1.8934 times |
Fri 07 November 2025 |
26.02 (19.63%) |
23.01 |
22.45 - 27.00 |
0.9276 times |
Fri 31 October 2025 |
21.75 (0%) |
20.04 |
20.04 - 21.89 |
0.0816 times |
Fri 31 October 2025 |
21.75 (4.07%) |
20.50 |
19.80 - 21.99 |
0.623 times |
Fri 24 October 2025 |
20.90 (3.31%) |
20.55 |
19.50 - 21.20 |
0.2095 times |
Fri 17 October 2025 |
20.23 (-7.46%) |
22.50 |
19.80 - 22.50 |
0.3074 times |
Fri 10 October 2025 |
21.86 (-9.29%) |
23.27 |
20.89 - 23.74 |
1.2595 times |
Fri 03 October 2025 |
24.10 (7.93%) |
22.29 |
21.08 - 24.46 |
0.3785 times |
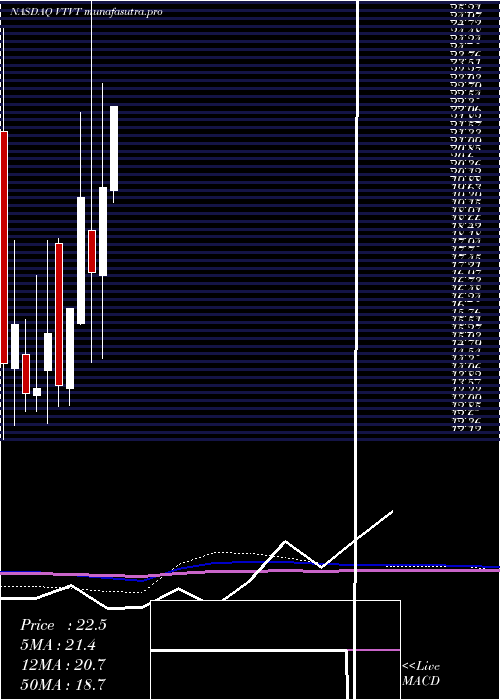
Monthly price and charts VtvTherapeutics Strong monthly Stock price targets for VtvTherapeutics VTVT are 25.14 and 30.22 | Monthly Target 1 | 21.01 | | Monthly Target 2 | 24.18 | | Monthly Target 3 | 26.09 | | Monthly Target 4 | 29.26 | | Monthly Target 5 | 31.17 |
Monthly price and volumes Vtv Therapeutics
| Date |
Closing |
Open |
Range |
Volume |
Fri 05 December 2025 |
27.35 (2.43%) |
25.63 |
22.92 - 28.00 |
0.2019 times |
Fri 28 November 2025 |
26.70 (22.76%) |
23.01 |
22.45 - 33.16 |
1.1426 times |
Fri 31 October 2025 |
21.75 (-6.85%) |
22.58 |
19.50 - 24.46 |
0.4641 times |
Tue 30 September 2025 |
23.35 (43.78%) |
17.05 |
17.00 - 23.81 |
0.5744 times |
Wed 27 August 2025 |
16.24 (8.63%) |
14.55 |
14.00 - 16.99 |
0.1167 times |
Wed 30 July 2025 |
14.95 (-0.33%) |
14.54 |
14.53 - 17.96 |
0.3084 times |
Mon 30 June 2025 |
15.00 (-5.6%) |
16.02 |
14.49 - 16.76 |
0.7549 times |
Fri 30 May 2025 |
15.89 (-20.35%) |
19.87 |
15.54 - 22.58 |
0.5803 times |
Wed 30 April 2025 |
19.95 (15.18%) |
17.23 |
14.63 - 23.20 |
1.2273 times |
Mon 31 March 2025 |
17.32 (-11.9%) |
18.61 |
14.53 - 26.99 |
4.6294 times |
Fri 28 February 2025 |
19.66 (21.43%) |
15.72 |
15.70 - 22.30 |
1.02 times |
DMA SMA EMA moving averages of Vtv Therapeutics VTVT
DMA (daily moving average) of Vtv Therapeutics VTVT
| DMA period | DMA value | | 5 day DMA | 25.86 | | 12 day DMA | 27.84 | | 20 day DMA | 28.53 | | 35 day DMA | 25.63 | | 50 day DMA | 24.75 | | 100 day DMA | 20.94 | | 150 day DMA | 20.16 | | 200 day DMA | 19.63 | EMA (exponential moving average) of Vtv Therapeutics VTVT
| EMA period | EMA current | EMA prev | EMA prev2 | | 5 day EMA | 26.76 | 26.46 | 26.01 | | 12 day EMA | 27.16 | 27.12 | 27.08 | | 20 day EMA | 27.05 | 27.02 | 26.98 | | 35 day EMA | 26.21 | 26.14 | 26.07 | | 50 day EMA | 24.66 | 24.55 | 24.44 |
SMA (simple moving average) of Vtv Therapeutics VTVT
| SMA period | SMA current | SMA prev | SMA prev2 | | 5 day SMA | 25.86 | 25.73 | 25.66 | | 12 day SMA | 27.84 | 28.07 | 28.3 | | 20 day SMA | 28.53 | 28.43 | 28.28 | | 35 day SMA | 25.63 | 25.49 | 25.33 | | 50 day SMA | 24.75 | 24.65 | 24.54 | | 100 day SMA | 20.94 | 20.81 | 20.7 | | 150 day SMA | 20.16 | 20.11 | 20.05 | | 200 day SMA | 19.63 | 19.57 | 19.51 |
|
|
