VastaPlatform VSTA full analysis,charts,indicators,moving averages,SMA,DMA,EMA,ADX,MACD,RSIVasta Platform VSTA WideScreen charts, DMA,SMA,EMA technical analysis, forecast prediction, by indicators ADX,MACD,RSI,CCI NASDAQ stock exchange
Daily price and charts and targets VastaPlatform Strong Daily Stock price targets for VastaPlatform VSTA are 4.91 and 4.94 | Daily Target 1 | 4.9 | | Daily Target 2 | 4.91 | | Daily Target 3 | 4.93 | | Daily Target 4 | 4.94 | | Daily Target 5 | 4.96 |
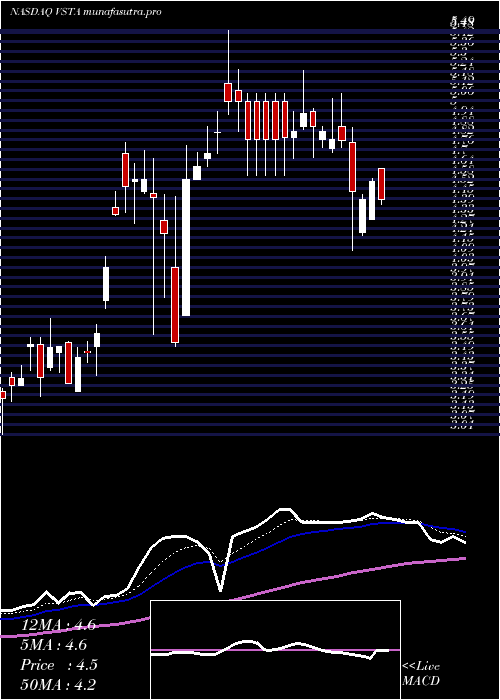
Daily price and volume Vasta Platform
| Date |
Closing |
Open |
Range |
Volume |
Fri 05 December 2025 |
4.92 (-1.01%) |
4.95 |
4.92 - 4.95 |
1.8539 times |
Thu 04 December 2025 |
4.97 (0.61%) |
4.92 |
4.92 - 4.97 |
0.165 times |
Wed 03 December 2025 |
4.94 (0.2%) |
4.94 |
4.92 - 4.96 |
2.4902 times |
Tue 02 December 2025 |
4.93 (-0.6%) |
4.96 |
4.92 - 4.97 |
2.9458 times |
Mon 01 December 2025 |
4.96 (0.2%) |
4.95 |
4.92 - 4.96 |
0.0943 times |
Fri 28 November 2025 |
4.95 (0.2%) |
4.92 |
4.92 - 4.96 |
0.6049 times |
Wed 26 November 2025 |
4.94 (-1.2%) |
4.97 |
4.92 - 4.99 |
1.0212 times |
Tue 25 November 2025 |
5.00 (0.2%) |
4.95 |
4.95 - 5.00 |
0.1571 times |
Mon 24 November 2025 |
4.99 (1.42%) |
5.00 |
4.92 - 5.00 |
0.542 times |
Fri 21 November 2025 |
4.92 (-0.4%) |
4.96 |
4.92 - 4.96 |
0.1257 times |
Thu 20 November 2025 |
4.94 (-0.2%) |
4.95 |
4.92 - 4.95 |
0.2907 times |
Weekly price and charts VastaPlatform Strong weekly Stock price targets for VastaPlatform VSTA are 4.9 and 4.95 | Weekly Target 1 | 4.89 | | Weekly Target 2 | 4.9 | | Weekly Target 3 | 4.9366666666667 | | Weekly Target 4 | 4.95 | | Weekly Target 5 | 4.99 |
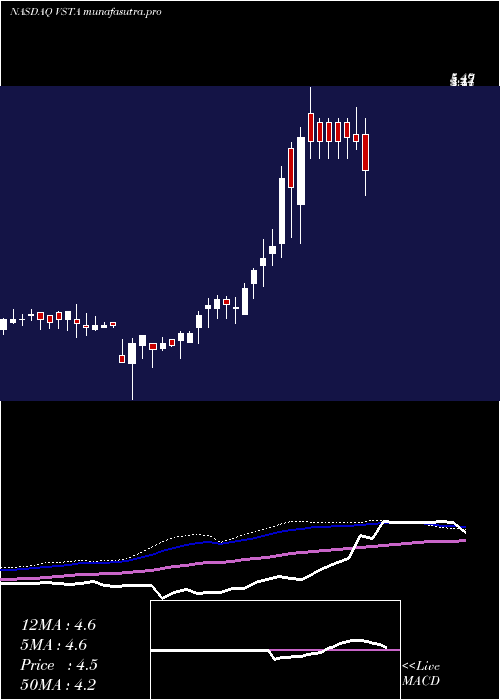
Weekly price and volumes for Vasta Platform
| Date |
Closing |
Open |
Range |
Volume |
Fri 05 December 2025 |
4.92 (-0.61%) |
4.95 |
4.92 - 4.97 |
1.0446 times |
Fri 28 November 2025 |
4.95 (0.61%) |
5.00 |
4.92 - 5.00 |
0.3217 times |
Fri 21 November 2025 |
4.92 (-1.01%) |
4.92 |
4.91 - 5.00 |
1.9446 times |
Fri 14 November 2025 |
4.97 (0%) |
4.97 |
4.92 - 4.98 |
0.363 times |
Fri 07 November 2025 |
4.97 (1.43%) |
4.98 |
4.80 - 4.98 |
0.6989 times |
Fri 31 October 2025 |
4.90 (0%) |
4.86 |
4.86 - 4.99 |
0.063 times |
Fri 31 October 2025 |
4.90 (-1.61%) |
4.97 |
4.58 - 4.99 |
0.9826 times |
Fri 24 October 2025 |
4.98 (0.61%) |
4.88 |
4.88 - 4.99 |
0.6467 times |
Fri 17 October 2025 |
4.95 (0.61%) |
4.86 |
4.82 - 4.98 |
1.387 times |
Fri 10 October 2025 |
4.92 (-0.4%) |
4.96 |
4.81 - 4.98 |
2.5478 times |
Fri 03 October 2025 |
4.94 (-0.2%) |
4.96 |
4.89 - 5.00 |
2.298 times |
Monthly price and charts VastaPlatform Strong monthly Stock price targets for VastaPlatform VSTA are 4.9 and 4.95 | Monthly Target 1 | 4.89 | | Monthly Target 2 | 4.9 | | Monthly Target 3 | 4.9366666666667 | | Monthly Target 4 | 4.95 | | Monthly Target 5 | 4.99 |
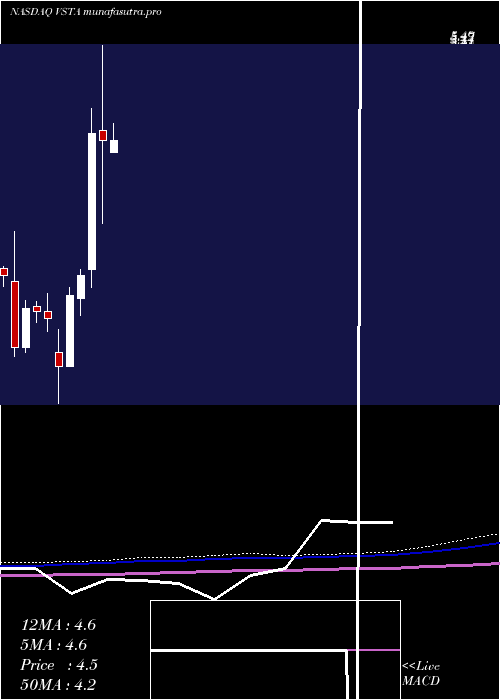
Monthly price and volumes Vasta Platform
| Date |
Closing |
Open |
Range |
Volume |
Fri 05 December 2025 |
4.92 (-0.61%) |
4.95 |
4.92 - 4.97 |
0.1456 times |
Fri 28 November 2025 |
4.95 (1.02%) |
4.98 |
4.80 - 5.00 |
0.4638 times |
Fri 31 October 2025 |
4.90 (-1.41%) |
4.99 |
4.58 - 4.99 |
0.8778 times |
Tue 30 September 2025 |
4.97 (16.12%) |
4.20 |
4.16 - 5.00 |
1.9731 times |
Fri 29 August 2025 |
4.28 (3.63%) |
4.17 |
3.78 - 4.38 |
0.4668 times |
Thu 31 July 2025 |
4.13 (-3.28%) |
4.21 |
3.90 - 4.30 |
0.3563 times |
Mon 30 June 2025 |
4.27 (1.91%) |
4.12 |
4.00 - 4.50 |
0.8272 times |
Fri 30 May 2025 |
4.19 (-5.84%) |
4.33 |
3.56 - 4.64 |
1.626 times |
Wed 30 April 2025 |
4.45 (-1.77%) |
4.56 |
3.55 - 5.49 |
2.4882 times |
Mon 31 March 2025 |
4.53 (51.51%) |
3.05 |
2.86 - 4.80 |
0.7753 times |
Fri 28 February 2025 |
2.99 (7.94%) |
2.74 |
2.55 - 3.05 |
0.4859 times |
DMA SMA EMA moving averages of Vasta Platform VSTA
DMA (daily moving average) of Vasta Platform VSTA
| DMA period | DMA value | | 5 day DMA | 4.94 | | 12 day DMA | 4.95 | | 20 day DMA | 4.96 | | 35 day DMA | 4.95 | | 50 day DMA | 4.95 | | 100 day DMA | 4.67 | | 150 day DMA | 4.51 | | 200 day DMA | 4.38 | EMA (exponential moving average) of Vasta Platform VSTA
| EMA period | EMA current | EMA prev | EMA prev2 | | 5 day EMA | 4.95 | 4.96 | 4.95 | | 12 day EMA | 4.95 | 4.96 | 4.96 | | 20 day EMA | 4.95 | 4.95 | 4.95 | | 35 day EMA | 4.94 | 4.94 | 4.94 | | 50 day EMA | 4.95 | 4.95 | 4.95 |
SMA (simple moving average) of Vasta Platform VSTA
| SMA period | SMA current | SMA prev | SMA prev2 | | 5 day SMA | 4.94 | 4.95 | 4.94 | | 12 day SMA | 4.95 | 4.96 | 4.96 | | 20 day SMA | 4.96 | 4.96 | 4.96 | | 35 day SMA | 4.95 | 4.95 | 4.95 | | 50 day SMA | 4.95 | 4.95 | 4.95 | | 100 day SMA | 4.67 | 4.66 | 4.65 | | 150 day SMA | 4.51 | 4.5 | 4.5 | | 200 day SMA | 4.38 | 4.37 | 4.36 |
|
|
