VertexPharmaceuticals VRTX full analysis,charts,indicators,moving averages,SMA,DMA,EMA,ADX,MACD,RSIVertex Pharmaceuticals VRTX WideScreen charts, DMA,SMA,EMA technical analysis, forecast prediction, by indicators ADX,MACD,RSI,CCI NASDAQ stock exchange
operates under Health Care sector & deals in Major Pharmaceuticals
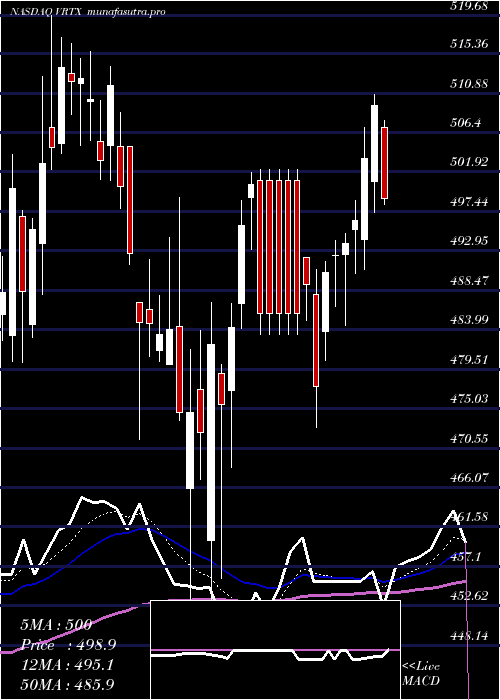
Daily price and charts and targets VertexPharmaceuticals Strong Daily Stock price targets for VertexPharmaceuticals VRTX are 451.19 and 458.74 | Daily Target 1 | 449.76 | | Daily Target 2 | 452.62 | | Daily Target 3 | 457.31 | | Daily Target 4 | 460.17 | | Daily Target 5 | 464.86 |
Daily price and volume Vertex Pharmaceuticals
| Date |
Closing |
Open |
Range |
Volume |
Fri 05 December 2025 |
455.48 (-0.41%) |
457.78 |
454.45 - 462.00 |
0.6028 times |
Thu 04 December 2025 |
457.36 (-1.25%) |
462.00 |
453.54 - 463.70 |
1.0047 times |
Wed 03 December 2025 |
463.13 (6.92%) |
440.31 |
439.35 - 463.85 |
1.6819 times |
Tue 02 December 2025 |
433.15 (1.77%) |
427.33 |
424.06 - 435.20 |
0.926 times |
Mon 01 December 2025 |
425.60 (-1.85%) |
431.92 |
423.45 - 434.00 |
0.7767 times |
Fri 28 November 2025 |
433.61 (0.33%) |
434.67 |
429.07 - 434.67 |
0.4815 times |
Wed 26 November 2025 |
432.17 (0.55%) |
432.43 |
428.07 - 433.32 |
0.762 times |
Tue 25 November 2025 |
429.82 (1.37%) |
425.92 |
424.12 - 431.50 |
1.0254 times |
Mon 24 November 2025 |
424.00 (-0.65%) |
426.23 |
423.87 - 432.55 |
1.4704 times |
Fri 21 November 2025 |
426.76 (1.05%) |
423.13 |
421.87 - 435.85 |
1.2685 times |
Thu 20 November 2025 |
422.32 (0.31%) |
420.84 |
420.00 - 431.13 |
0.7867 times |
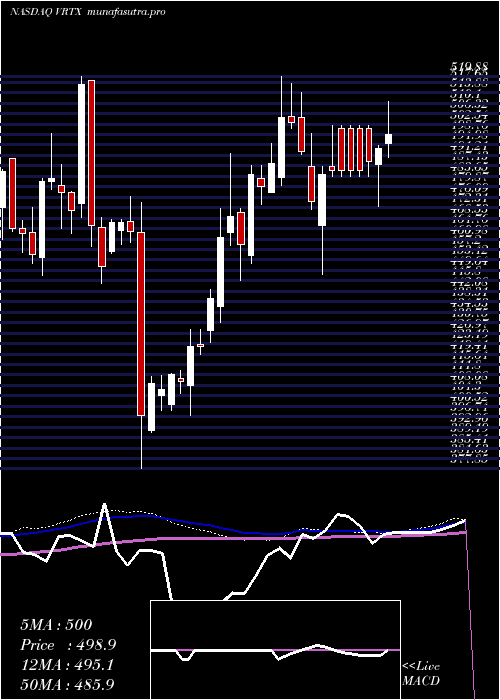
Weekly price and charts VertexPharmaceuticals Strong weekly Stock price targets for VertexPharmaceuticals VRTX are 439.47 and 479.87 | Weekly Target 1 | 407.19 | | Weekly Target 2 | 431.34 | | Weekly Target 3 | 447.59333333333 | | Weekly Target 4 | 471.74 | | Weekly Target 5 | 487.99 |
Weekly price and volumes for Vertex Pharmaceuticals
| Date |
Closing |
Open |
Range |
Volume |
Fri 05 December 2025 |
455.48 (5.04%) |
431.92 |
423.45 - 463.85 |
1.3008 times |
Fri 28 November 2025 |
433.61 (1.61%) |
426.23 |
423.87 - 434.67 |
0.9744 times |
Fri 21 November 2025 |
426.76 (-2.38%) |
436.99 |
418.53 - 439.99 |
1.2137 times |
Fri 14 November 2025 |
437.15 (6.77%) |
412.38 |
410.50 - 442.22 |
1.011 times |
Fri 07 November 2025 |
409.42 (-3.79%) |
418.55 |
403.16 - 430.71 |
0.8509 times |
Fri 31 October 2025 |
425.57 (0%) |
416.28 |
415.76 - 426.96 |
0.2584 times |
Fri 31 October 2025 |
425.57 (0.99%) |
422.00 |
415.00 - 426.96 |
1.1273 times |
Fri 24 October 2025 |
421.39 (1.1%) |
418.17 |
414.52 - 432.76 |
1.1415 times |
Fri 17 October 2025 |
416.81 (2.21%) |
404.21 |
402.58 - 419.37 |
0.9603 times |
Fri 10 October 2025 |
407.79 (1.11%) |
404.66 |
400.74 - 422.73 |
1.1618 times |
Fri 03 October 2025 |
403.30 (4.55%) |
386.88 |
384.39 - 411.91 |
1.5074 times |
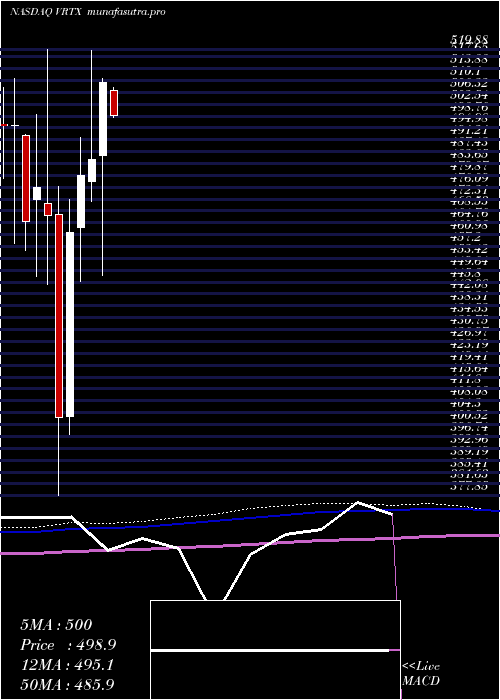
Monthly price and charts VertexPharmaceuticals Strong monthly Stock price targets for VertexPharmaceuticals VRTX are 439.47 and 479.87 | Monthly Target 1 | 407.19 | | Monthly Target 2 | 431.34 | | Monthly Target 3 | 447.59333333333 | | Monthly Target 4 | 471.74 | | Monthly Target 5 | 487.99 |
Monthly price and volumes Vertex Pharmaceuticals
| Date |
Closing |
Open |
Range |
Volume |
Fri 05 December 2025 |
455.48 (5.04%) |
431.92 |
423.45 - 463.85 |
0.2476 times |
Fri 28 November 2025 |
433.61 (1.89%) |
418.55 |
403.16 - 442.22 |
0.7709 times |
Fri 31 October 2025 |
425.57 (8.66%) |
393.62 |
392.49 - 432.76 |
1.0294 times |
Tue 30 September 2025 |
391.64 (0.16%) |
391.02 |
374.17 - 402.74 |
1.161 times |
Fri 29 August 2025 |
391.02 (-14.41%) |
457.39 |
362.50 - 464.23 |
1.706 times |
Thu 31 July 2025 |
456.87 (2.62%) |
445.50 |
443.49 - 484.56 |
0.7781 times |
Mon 30 June 2025 |
445.20 (0.71%) |
441.27 |
436.80 - 460.33 |
0.8295 times |
Fri 30 May 2025 |
442.05 (-13.24%) |
507.00 |
416.60 - 509.00 |
1.4924 times |
Wed 30 April 2025 |
509.50 (5.09%) |
486.27 |
448.14 - 510.77 |
1.1064 times |
Mon 31 March 2025 |
484.82 (1.05%) |
477.82 |
471.50 - 519.68 |
0.8787 times |
Fri 28 February 2025 |
479.79 (3.92%) |
463.36 |
446.00 - 491.81 |
0.9009 times |
DMA SMA EMA moving averages of Vertex Pharmaceuticals VRTX
DMA (daily moving average) of Vertex Pharmaceuticals VRTX
| DMA period | DMA value | | 5 day DMA | 446.94 | | 12 day DMA | 435.37 | | 20 day DMA | 433 | | 35 day DMA | 427.95 | | 50 day DMA | 421.19 | | 100 day DMA | 414.25 | | 150 day DMA | 426.21 | | 200 day DMA | 442.36 | EMA (exponential moving average) of Vertex Pharmaceuticals VRTX
| EMA period | EMA current | EMA prev | EMA prev2 | | 5 day EMA | 449.57 | 446.61 | 441.23 | | 12 day EMA | 440.45 | 437.72 | 434.15 | | 20 day EMA | 434.97 | 432.81 | 430.23 | | 35 day EMA | 427.14 | 425.47 | 423.59 | | 50 day EMA | 420.57 | 419.15 | 417.59 |
SMA (simple moving average) of Vertex Pharmaceuticals VRTX
| SMA period | SMA current | SMA prev | SMA prev2 | | 5 day SMA | 446.94 | 442.57 | 437.53 | | 12 day SMA | 435.37 | 433.71 | 431.76 | | 20 day SMA | 433 | 431.03 | 429.02 | | 35 day SMA | 427.95 | 426.62 | 425.2 | | 50 day SMA | 421.19 | 419.72 | 418.11 | | 100 day SMA | 414.25 | 414.39 | 414.46 | | 150 day SMA | 426.21 | 426.5 | 426.84 | | 200 day SMA | 442.36 | 442.48 | 442.56 |
|
|
