VerisignInc VRSN full analysis,charts,indicators,moving averages,SMA,DMA,EMA,ADX,MACD,RSIVerisign Inc VRSN WideScreen charts, DMA,SMA,EMA technical analysis, forecast prediction, by indicators ADX,MACD,RSI,CCI NASDAQ stock exchange
operates under Technology sector & deals in EDP Services
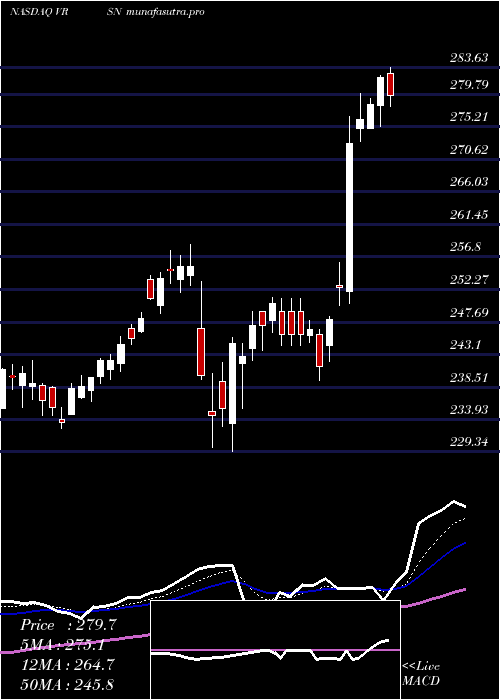
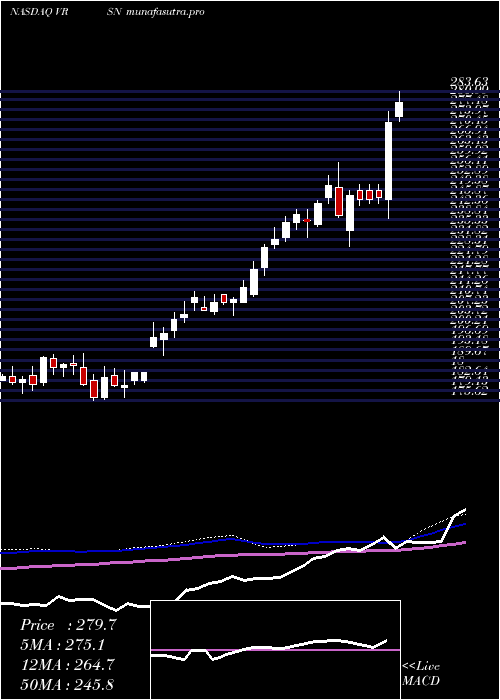
Daily price and charts and targets VerisignInc Strong Daily Stock price targets for VerisignInc VRSN are 248.62 and 251.8 | Daily Target 1 | 246.19 | | Daily Target 2 | 247.87 | | Daily Target 3 | 249.37333333333 | | Daily Target 4 | 251.05 | | Daily Target 5 | 252.55 |
Daily price and volume Verisign Inc
| Date |
Closing |
Open |
Range |
Volume |
Fri 05 December 2025 |
249.54 (0.33%) |
248.73 |
247.70 - 250.88 |
0.6194 times |
Thu 04 December 2025 |
248.73 (-0.48%) |
249.00 |
247.57 - 252.47 |
0.3819 times |
Wed 03 December 2025 |
249.94 (-1.44%) |
253.61 |
248.85 - 255.92 |
1.7006 times |
Tue 02 December 2025 |
253.58 (1.02%) |
252.62 |
251.08 - 256.36 |
0.3632 times |
Mon 01 December 2025 |
251.02 (-0.38%) |
251.07 |
249.88 - 254.15 |
1.1691 times |
Fri 28 November 2025 |
251.99 (-0.27%) |
252.67 |
251.53 - 254.56 |
2.2265 times |
Wed 26 November 2025 |
252.67 (-1.18%) |
255.30 |
251.79 - 255.99 |
0.8202 times |
Tue 25 November 2025 |
255.68 (2.51%) |
250.22 |
248.22 - 257.09 |
0.8454 times |
Mon 24 November 2025 |
249.41 (-0.8%) |
251.04 |
248.10 - 253.05 |
0.4019 times |
Fri 21 November 2025 |
251.42 (1.21%) |
248.59 |
246.07 - 254.74 |
1.4717 times |
Thu 20 November 2025 |
248.42 (1.08%) |
248.45 |
246.48 - 249.74 |
2.9145 times |
Weekly price and charts VerisignInc Strong weekly Stock price targets for VerisignInc VRSN are 244.16 and 252.95 | Weekly Target 1 | 242.37 | | Weekly Target 2 | 245.95 | | Weekly Target 3 | 251.15666666667 | | Weekly Target 4 | 254.74 | | Weekly Target 5 | 259.95 |
Weekly price and volumes for Verisign Inc
| Date |
Closing |
Open |
Range |
Volume |
Fri 05 December 2025 |
249.54 (-0.97%) |
251.07 |
247.57 - 256.36 |
0.8656 times |
Fri 28 November 2025 |
251.99 (0.23%) |
251.04 |
248.10 - 257.09 |
0.8778 times |
Fri 21 November 2025 |
251.42 (-0.58%) |
253.06 |
244.13 - 255.30 |
1.5443 times |
Fri 14 November 2025 |
252.88 (4.51%) |
242.96 |
242.11 - 255.68 |
0.9786 times |
Fri 07 November 2025 |
241.97 (0.9%) |
244.52 |
237.34 - 245.58 |
0.8157 times |
Fri 31 October 2025 |
239.80 (0%) |
235.87 |
233.82 - 240.42 |
0.2332 times |
Fri 31 October 2025 |
239.80 (-3.05%) |
245.11 |
231.00 - 251.42 |
1.5388 times |
Fri 24 October 2025 |
247.35 (-6.59%) |
265.10 |
225.41 - 269.47 |
1.5886 times |
Fri 17 October 2025 |
264.79 (1.52%) |
260.63 |
258.28 - 267.68 |
0.8523 times |
Fri 10 October 2025 |
260.82 (-4.45%) |
273.61 |
260.03 - 274.08 |
0.7052 times |
Fri 03 October 2025 |
272.98 (-4.02%) |
284.50 |
271.04 - 288.12 |
0.9474 times |
Monthly price and charts VerisignInc Strong monthly Stock price targets for VerisignInc VRSN are 244.16 and 252.95 | Monthly Target 1 | 242.37 | | Monthly Target 2 | 245.95 | | Monthly Target 3 | 251.15666666667 | | Monthly Target 4 | 254.74 | | Monthly Target 5 | 259.95 |
Monthly price and volumes Verisign Inc
| Date |
Closing |
Open |
Range |
Volume |
Fri 05 December 2025 |
249.54 (-0.97%) |
251.07 |
247.57 - 256.36 |
0.2108 times |
Fri 28 November 2025 |
251.99 (5.08%) |
244.52 |
237.34 - 257.09 |
1.0267 times |
Fri 31 October 2025 |
239.80 (-14.23%) |
278.43 |
225.41 - 279.87 |
1.2978 times |
Tue 30 September 2025 |
279.57 (2.27%) |
270.46 |
269.50 - 290.82 |
0.9227 times |
Fri 29 August 2025 |
273.37 (1.67%) |
268.17 |
261.23 - 275.92 |
1.0893 times |
Thu 31 July 2025 |
268.87 (-6.9%) |
290.17 |
263.94 - 310.60 |
1.2489 times |
Mon 30 June 2025 |
288.80 (5.99%) |
271.00 |
270.00 - 290.38 |
0.795 times |
Fri 30 May 2025 |
272.47 (-3.42%) |
282.72 |
265.24 - 288.95 |
1.2163 times |
Wed 30 April 2025 |
282.12 (11.13%) |
255.08 |
229.34 - 282.49 |
1.2387 times |
Mon 31 March 2025 |
253.87 (6.72%) |
237.88 |
232.66 - 254.63 |
0.9539 times |
Fri 28 February 2025 |
237.88 (10.64%) |
212.53 |
211.79 - 239.95 |
1.0166 times |
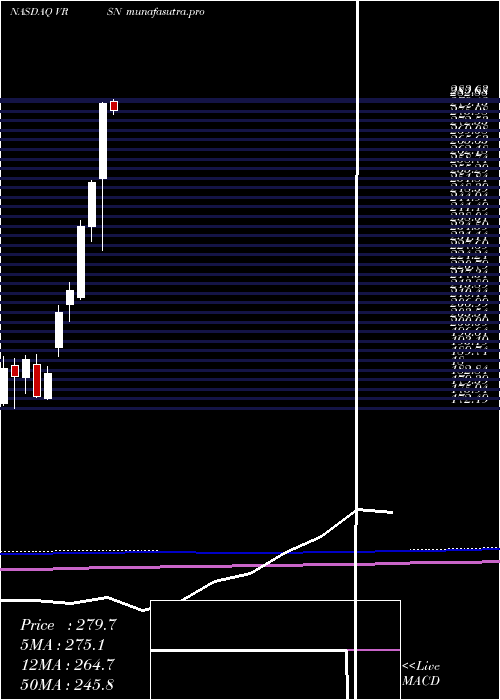
DMA SMA EMA moving averages of Verisign Inc VRSN
DMA (daily moving average) of Verisign Inc VRSN
| DMA period | DMA value | | 5 day DMA | 250.56 | | 12 day DMA | 250.68 | | 20 day DMA | 250.06 | | 35 day DMA | 248.81 | | 50 day DMA | 255.33 | | 100 day DMA | 266.7 | | 150 day DMA | 271.59 | | 200 day DMA | 265.14 | EMA (exponential moving average) of Verisign Inc VRSN
| EMA period | EMA current | EMA prev | EMA prev2 | | 5 day EMA | 250.23 | 250.58 | 251.5 | | 12 day EMA | 250.39 | 250.54 | 250.87 | | 20 day EMA | 250.54 | 250.64 | 250.84 | | 35 day EMA | 254.21 | 254.49 | 254.83 | | 50 day EMA | 257.2 | 257.51 | 257.87 |
SMA (simple moving average) of Verisign Inc VRSN
| SMA period | SMA current | SMA prev | SMA prev2 | | 5 day SMA | 250.56 | 251.05 | 251.84 | | 12 day SMA | 250.68 | 250.69 | 250.81 | | 20 day SMA | 250.06 | 249.56 | 249.33 | | 35 day SMA | 248.81 | 249.11 | 249.59 | | 50 day SMA | 255.33 | 256.01 | 256.74 | | 100 day SMA | 266.7 | 267.04 | 267.37 | | 150 day SMA | 271.59 | 271.79 | 272.02 | | 200 day SMA | 265.14 | 265.05 | 264.95 |
|
|
