VerifymeInc VRMEW full analysis,charts,indicators,moving averages,SMA,DMA,EMA,ADX,MACD,RSIVerifyme Inc VRMEW WideScreen charts, DMA,SMA,EMA technical analysis, forecast prediction, by indicators ADX,MACD,RSI,CCI NASDAQ stock exchange
Daily price and charts and targets VerifymeInc Strong Daily Stock price targets for VerifymeInc VRMEW are 0 and 0.02 | Daily Target 1 | 0 | | Daily Target 2 | -0 | | Daily Target 3 | 0.016666666666667 | | Daily Target 4 | 0.02 | | Daily Target 5 | 0.04 |
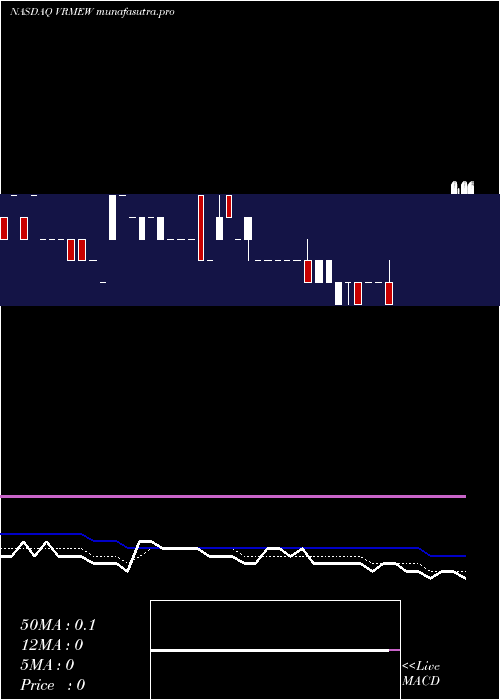
Daily price and volume Verifyme Inc
| Date |
Closing |
Open |
Range |
Volume |
Mon 23 June 2025 |
0.01 (-50%) |
0.02 |
0.01 - 0.03 |
1.1922 times |
Fri 20 June 2025 |
0.02 (0%) |
0.02 |
0.02 - 0.02 |
0.5807 times |
Wed 18 June 2025 |
0.02 (100%) |
0.02 |
0.02 - 0.02 |
0.2724 times |
Tue 17 June 2025 |
0.01 (-50%) |
0.02 |
0.01 - 0.02 |
1.4645 times |
Fri 13 June 2025 |
0.02 (0%) |
0.02 |
0.01 - 0.02 |
0.3135 times |
Thu 12 June 2025 |
0.02 (-33.33%) |
0.01 |
0.01 - 0.02 |
0.3854 times |
Wed 11 June 2025 |
0.03 (0%) |
0.02 |
0.02 - 0.03 |
0.2312 times |
Fri 06 June 2025 |
0.03 (50%) |
0.02 |
0.02 - 0.03 |
1.0843 times |
Thu 05 June 2025 |
0.02 (-33.33%) |
0.03 |
0.02 - 0.04 |
3.8592 times |
Wed 04 June 2025 |
0.03 (0%) |
0.03 |
0.03 - 0.03 |
0.6166 times |
Tue 03 June 2025 |
0.03 (0%) |
0.03 |
0.03 - 0.03 |
0.1285 times |
Weekly price and charts VerifymeInc Strong weekly Stock price targets for VerifymeInc VRMEW are 0 and 0.02 | Weekly Target 1 | 0 | | Weekly Target 2 | -0 | | Weekly Target 3 | 0.016666666666667 | | Weekly Target 4 | 0.02 | | Weekly Target 5 | 0.04 |
Weekly price and volumes for Verifyme Inc
| Date |
Closing |
Open |
Range |
Volume |
Mon 23 June 2025 |
0.01 (-50%) |
0.02 |
0.01 - 0.03 |
0.6437 times |
Fri 20 June 2025 |
0.02 (0%) |
0.02 |
0.01 - 0.02 |
1.2514 times |
Fri 13 June 2025 |
0.02 (-33.33%) |
0.02 |
0.01 - 0.03 |
0.5022 times |
Fri 06 June 2025 |
0.03 (0%) |
0.03 |
0.02 - 0.04 |
3.0993 times |
Fri 30 May 2025 |
0.03 (-40%) |
0.04 |
0.03 - 0.05 |
1.4012 times |
Fri 23 May 2025 |
0.05 (25%) |
0.06 |
0.03 - 0.06 |
0.2802 times |
Fri 16 May 2025 |
0.04 (0%) |
0.04 |
0.04 - 0.04 |
1.3541 times |
Fri 09 May 2025 |
0.04 (-20%) |
0.05 |
0.04 - 0.05 |
0.6271 times |
Fri 02 May 2025 |
0.05 (-16.67%) |
0.06 |
0.04 - 0.06 |
0.4606 times |
Thu 24 April 2025 |
0.06 (200%) |
0.04 |
0.04 - 0.06 |
0.3801 times |
Thu 17 April 2025 |
0.02 (-33.33%) |
0.03 |
0.02 - 0.03 |
0.9231 times |

Monthly price and charts VerifymeInc Strong monthly Stock price targets for VerifymeInc VRMEW are -0 and 0.03 | Monthly Target 1 | -0.01 | | Monthly Target 2 | 0 | | Monthly Target 3 | 0.02 | | Monthly Target 4 | 0.03 | | Monthly Target 5 | 0.05 |
Monthly price and volumes Verifyme Inc
| Date |
Closing |
Open |
Range |
Volume |
Mon 23 June 2025 |
0.01 (-66.67%) |
0.03 |
0.01 - 0.04 |
0.3396 times |
Fri 30 May 2025 |
0.03 (-50%) |
0.05 |
0.03 - 0.06 |
0.2375 times |
Tue 29 April 2025 |
0.06 (50%) |
0.04 |
0.02 - 0.06 |
0.1983 times |
Mon 31 March 2025 |
0.04 (-55.56%) |
0.09 |
0.04 - 0.09 |
0.2524 times |
Fri 28 February 2025 |
0.09 (-52.63%) |
0.16 |
0.07 - 0.17 |
0.1552 times |
Fri 31 January 2025 |
0.19 (533.33%) |
0.09 |
0.04 - 0.75 |
6.6825 times |
Tue 31 December 2024 |
0.03 (-25%) |
0.03 |
0.00 - 0.09 |
2.0649 times |
Mon 25 November 2024 |
0.04 (-33.33%) |
0.05 |
0.03 - 0.05 |
0.0029 times |
Mon 28 October 2024 |
0.06 (0%) |
0.05 |
0.03 - 0.06 |
0.0569 times |
Thu 26 September 2024 |
0.06 (20%) |
0.04 |
0.04 - 0.06 |
0.0098 times |
Fri 30 August 2024 |
0.05 (25%) |
0.04 |
0.04 - 0.06 |
0.0046 times |

DMA SMA EMA moving averages of Verifyme Inc VRMEW
DMA (daily moving average) of Verifyme Inc VRMEW
| DMA period | DMA value | | 5 day DMA | 0.02 | | 12 day DMA | 0.02 | | 20 day DMA | 0.03 | | 35 day DMA | 0.03 | | 50 day DMA | 0.04 | | 100 day DMA | 0.09 | | 150 day DMA | 0.08 | | 200 day DMA | 0.07 | EMA (exponential moving average) of Verifyme Inc VRMEW
| EMA period | EMA current | EMA prev | EMA prev2 | | 5 day EMA | 0.02 | 0.02 | 0.02 | | 12 day EMA | 0.04 | 0.04 | 0.04 | | 20 day EMA | 0.06 | 0.06 | 0.06 | | 35 day EMA | 0.06 | 0.06 | 0.06 | | 50 day EMA | 0.05 | 0.05 | 0.05 |
SMA (simple moving average) of Verifyme Inc VRMEW
| SMA period | SMA current | SMA prev | SMA prev2 | | 5 day SMA | 0.02 | 0.02 | 0.02 | | 12 day SMA | 0.02 | 0.02 | 0.03 | | 20 day SMA | 0.03 | 0.03 | 0.03 | | 35 day SMA | 0.03 | 0.04 | 0.04 | | 50 day SMA | 0.04 | 0.04 | 0.05 | | 100 day SMA | 0.09 | 0.09 | 0.09 | | 150 day SMA | 0.08 | 0.08 | 0.08 | | 200 day SMA | 0.07 | 0.07 | 0.07 |
|
|
