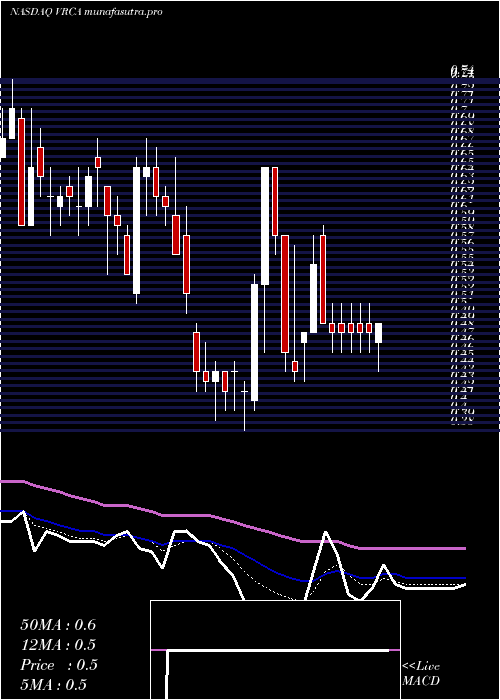
VerricaPharmaceuticals VRCA full analysis,charts,indicators,moving averages,SMA,DMA,EMA,ADX,MACD,RSIVerrica Pharmaceuticals VRCA WideScreen charts, DMA,SMA,EMA technical analysis, forecast prediction, by indicators ADX,MACD,RSI,CCI NASDAQ stock exchange
operates under Health Care sector & deals in Major Pharmaceuticals
Daily price and charts and targets VerricaPharmaceuticals Strong Daily Stock price targets for VerricaPharmaceuticals VRCA are 0.74 and 0.83 | Daily Target 1 | 0.71 | | Daily Target 2 | 0.76 | | Daily Target 3 | 0.80333333333333 | | Daily Target 4 | 0.85 | | Daily Target 5 | 0.89 |
Daily price and volume Verrica Pharmaceuticals
| Date |
Closing |
Open |
Range |
Volume |
Tue 15 July 2025 |
0.80 (-2.44%) |
0.83 |
0.76 - 0.85 |
0.2032 times |
Mon 14 July 2025 |
0.82 (1.23%) |
0.78 |
0.72 - 0.83 |
0.5081 times |
Fri 11 July 2025 |
0.81 (-6.9%) |
0.85 |
0.77 - 0.90 |
0.4656 times |
Thu 10 July 2025 |
0.87 (6.1%) |
0.82 |
0.80 - 0.95 |
0.6512 times |
Wed 09 July 2025 |
0.82 (-4.65%) |
0.88 |
0.77 - 0.95 |
1.4135 times |
Tue 08 July 2025 |
0.86 (3.61%) |
0.83 |
0.79 - 0.87 |
0.5462 times |
Mon 07 July 2025 |
0.83 (16.9%) |
0.71 |
0.70 - 0.84 |
0.7102 times |
Thu 03 July 2025 |
0.71 (9.23%) |
0.66 |
0.65 - 0.72 |
0.5062 times |
Wed 02 July 2025 |
0.65 (8.33%) |
0.62 |
0.58 - 0.66 |
1.0836 times |
Tue 01 July 2025 |
0.60 (13.21%) |
0.54 |
0.53 - 0.67 |
3.9121 times |
Mon 30 June 2025 |
0.53 (1.92%) |
0.53 |
0.53 - 0.55 |
0.1784 times |
Weekly price and charts VerricaPharmaceuticals Strong weekly Stock price targets for VerricaPharmaceuticals VRCA are 0.76 and 0.89 | Weekly Target 1 | 0.66 | | Weekly Target 2 | 0.73 | | Weekly Target 3 | 0.79 | | Weekly Target 4 | 0.86 | | Weekly Target 5 | 0.92 |
Weekly price and volumes for Verrica Pharmaceuticals
| Date |
Closing |
Open |
Range |
Volume |
Tue 15 July 2025 |
0.80 (-1.23%) |
0.78 |
0.72 - 0.85 |
0.3134 times |
Fri 11 July 2025 |
0.81 (14.08%) |
0.71 |
0.70 - 0.95 |
1.6687 times |
Thu 03 July 2025 |
0.71 (36.54%) |
0.53 |
0.53 - 0.72 |
2.5031 times |
Fri 27 June 2025 |
0.52 (-10.34%) |
0.58 |
0.52 - 0.67 |
2.093 times |
Fri 20 June 2025 |
0.58 (-6.45%) |
0.65 |
0.57 - 0.71 |
0.3824 times |
Fri 13 June 2025 |
0.62 (1.64%) |
0.61 |
0.56 - 0.68 |
0.7103 times |
Fri 06 June 2025 |
0.61 (24.49%) |
0.50 |
0.49 - 0.64 |
0.5546 times |
Fri 30 May 2025 |
0.49 (-19.67%) |
0.60 |
0.49 - 0.62 |
0.4966 times |
Fri 23 May 2025 |
0.61 (-7.58%) |
0.67 |
0.60 - 0.73 |
0.3514 times |
Fri 16 May 2025 |
0.66 (50%) |
0.46 |
0.43 - 0.72 |
0.9265 times |
Fri 09 May 2025 |
0.44 (-6.38%) |
0.47 |
0.39 - 0.49 |
0.5576 times |

Monthly price and charts VerricaPharmaceuticals Strong monthly Stock price targets for VerricaPharmaceuticals VRCA are 0.67 and 1.09 | Monthly Target 1 | 0.34 | | Monthly Target 2 | 0.57 | | Monthly Target 3 | 0.76 | | Monthly Target 4 | 0.99 | | Monthly Target 5 | 1.18 |
Monthly price and volumes Verrica Pharmaceuticals
| Date |
Closing |
Open |
Range |
Volume |
Tue 15 July 2025 |
0.80 (50.94%) |
0.54 |
0.53 - 0.95 |
0.8843 times |
Mon 30 June 2025 |
0.53 (8.16%) |
0.50 |
0.49 - 0.71 |
0.7664 times |
Fri 30 May 2025 |
0.49 (6.52%) |
0.48 |
0.39 - 0.73 |
0.4994 times |
Wed 30 April 2025 |
0.46 (4.55%) |
0.44 |
0.38 - 0.65 |
0.741 times |
Mon 31 March 2025 |
0.44 (-32.31%) |
0.67 |
0.39 - 0.69 |
0.9736 times |
Fri 28 February 2025 |
0.65 (0%) |
0.64 |
0.59 - 0.78 |
0.4644 times |
Fri 31 January 2025 |
0.65 (-7.14%) |
0.70 |
0.62 - 0.76 |
0.6776 times |
Tue 31 December 2024 |
0.70 (-36.94%) |
0.99 |
0.61 - 1.03 |
1.037 times |
Tue 26 November 2024 |
1.11 (-20.71%) |
1.43 |
0.70 - 1.56 |
1.8378 times |
Thu 31 October 2024 |
1.40 (-3.45%) |
1.48 |
1.04 - 1.74 |
2.1185 times |
Mon 30 September 2024 |
1.45 (-38.3%) |
2.35 |
1.45 - 2.44 |
1.0572 times |

DMA SMA EMA moving averages of Verrica Pharmaceuticals VRCA
DMA (daily moving average) of Verrica Pharmaceuticals VRCA
| DMA period | DMA value | | 5 day DMA | 0.82 | | 12 day DMA | 0.74 | | 20 day DMA | 0.68 | | 35 day DMA | 0.64 | | 50 day DMA | 0.61 | | 100 day DMA | 0.58 | | 150 day DMA | 0.62 | | 200 day DMA | 0.79 | EMA (exponential moving average) of Verrica Pharmaceuticals VRCA
| EMA period | EMA current | EMA prev | EMA prev2 | | 5 day EMA | 0.81 | 0.81 | 0.8 | | 12 day EMA | 0.76 | 0.75 | 0.74 | | 20 day EMA | 0.71 | 0.7 | 0.69 | | 35 day EMA | 0.65 | 0.64 | 0.63 | | 50 day EMA | 0.62 | 0.61 | 0.6 |
SMA (simple moving average) of Verrica Pharmaceuticals VRCA
| SMA period | SMA current | SMA prev | SMA prev2 | | 5 day SMA | 0.82 | 0.84 | 0.84 | | 12 day SMA | 0.74 | 0.72 | 0.7 | | 20 day SMA | 0.68 | 0.67 | 0.66 | | 35 day SMA | 0.64 | 0.63 | 0.63 | | 50 day SMA | 0.61 | 0.6 | 0.59 | | 100 day SMA | 0.58 | 0.58 | 0.58 | | 150 day SMA | 0.62 | 0.62 | 0.62 | | 200 day SMA | 0.79 | 0.8 | 0.8 |
|
|
